The business impact of off-route fleet refueling
Discover the true cost of going off-route to get fuel.
By Geotab Team
Nov 25, 2024

Going to the gas station is a common task for fleet drivers. Some fleet operations refuel every day and others refuel just a few times each week. Some drivers have to travel miles off-route to get to the gas station, while others only drive a few hundred feet.
With fuel costs on the rise, it is important now more than ever to understand the impact that fuel has on your fleet’s bottom line. Each trip to the gas station requires time to get there, time to pay, time to refuel, and time to get back on route.
To help get a better idea of how much impact off-route fleet refueling has on a business, we analyzed connected vehicle data from fleets in key markets across the United States to provide insights on cost to help businesses discover areas for improvement. This detailed study was conducted by data scientists at Geotab over a period of six months, based on insights from 14 million trips made by over 150,000 vehicles.
Key findings
- Drivers are diverted an average of two miles out of the way to get gas
- Drivers are spending about 8 minutes at the gas station each time they stop for fuel
- Vehicles have on average one-third of a tank of fuel remaining when drivers stop for gas
- A gas station stop adds more than 20 minutes to each trip a vehicle makes for fuel
- Gas station stops release an average of 3 pounds of CO2 into the atmosphere each month
How we calculated Total Trip Time
There are two factors that go into calculating Total Trip Time (total amount of time spent refueling):
- Off-Route Time (ORT): Time spent off-route traveling to and from the gas station
- Station Dwell Time (SDT): The amount of time spent at the gas station, measured by the amount of time the vehicle was idle at the station.
In this study, Total Trip Time was determined by analyzing all routes across each city, then adding actual visits to fueling stations as part of those routes. The time difference between the same route, compared to the route with the addition of a gas station stop produces an average of the Total Trip Time.
Average refueling times
Here are some key figures to note:
- ORT averaged 8 minutes.
- SDT at gas stations was 12 minutes, on average, for all fleet vehicles.
- The effect of both ORT and SDT on Total Trip Time averaged 20 minutes across all markets.
- The average ORT for each trip was 2.2 miles.
While this analysis mostly focused on the impact of fueling time, distance traveled off-route shows additional mileage that a vehicle incurs as a result of fueling at the gas station.
![[alt text: Bar graph showing average refueling times in minutes for Off-Route Time (ORT) and Station Dwell Time (SDT).]](https://www.geotab.com/CMS-Media-production/Blog/NA/2022/April/Fleet-refueling/Fleet-refueling-impact-blog-image-infographic1-871893145-Geotab-web-EN NA-final-Apr22.png)
Average total trip time by region
Breaking it down by region, there is a large discrepancy in Total Trip Time with ORT having the most effect on a metro’s Total Trip Time. The shortest average Total Trip Time took 11 minutes in San Jose, California, with an average ORT of 4 minutes and SDT of 7 minutes.
However, to find the metro region with the longest Total Fueling Time you don’t have to leave California. Los Angeles has an SDT of 7 minutes and ORT of 21 minutes. The average Total Trip Time is 28 minutes, almost three times as long as San Jose.
![[alt text: Bar graph showing the average total trip time by region.]](https://www.geotab.com/CMS-Media-production/Blog/NA/2022/April/Fleet-refueling/Fleet-refueling-impact-blog-image-infographic2-871893145-Geotab-web-EN NA-final-Apr22.png)
Distance by region and fuel optimization
In all geographies, trips to the gas station took vehicles miles off-route. However, there is huge variability in off-route distances when we look at it by region and city. For example, Austin drivers experience six times fewer off-route miles than Los Angeles, and eight times fewer than Washington DC. California, as a region, racks up almost three times more off-route miles than Texas.
Extrapolating these numbers over a year, a driver and their vehicle in Washington, D.C. will accumulate over 425 additional miles driving to get gas. The regional average of miles accrued for drivers and their vehicles is between 200-250 miles annually.
While there is a difference in additional miles driven, one thing is common: drivers are not optimizing their fueling visits.
![[alt text: Line graph showing the distance by region and fuel optimization in miles.]](https://www.geotab.com/CMS-Media-production/Blog/NA/2022/April/Fleet-refueling/Fleet-refueling-impact-blog-image-infographic3-871893145-Geotab-web-EN NA-final-Apr22.png)
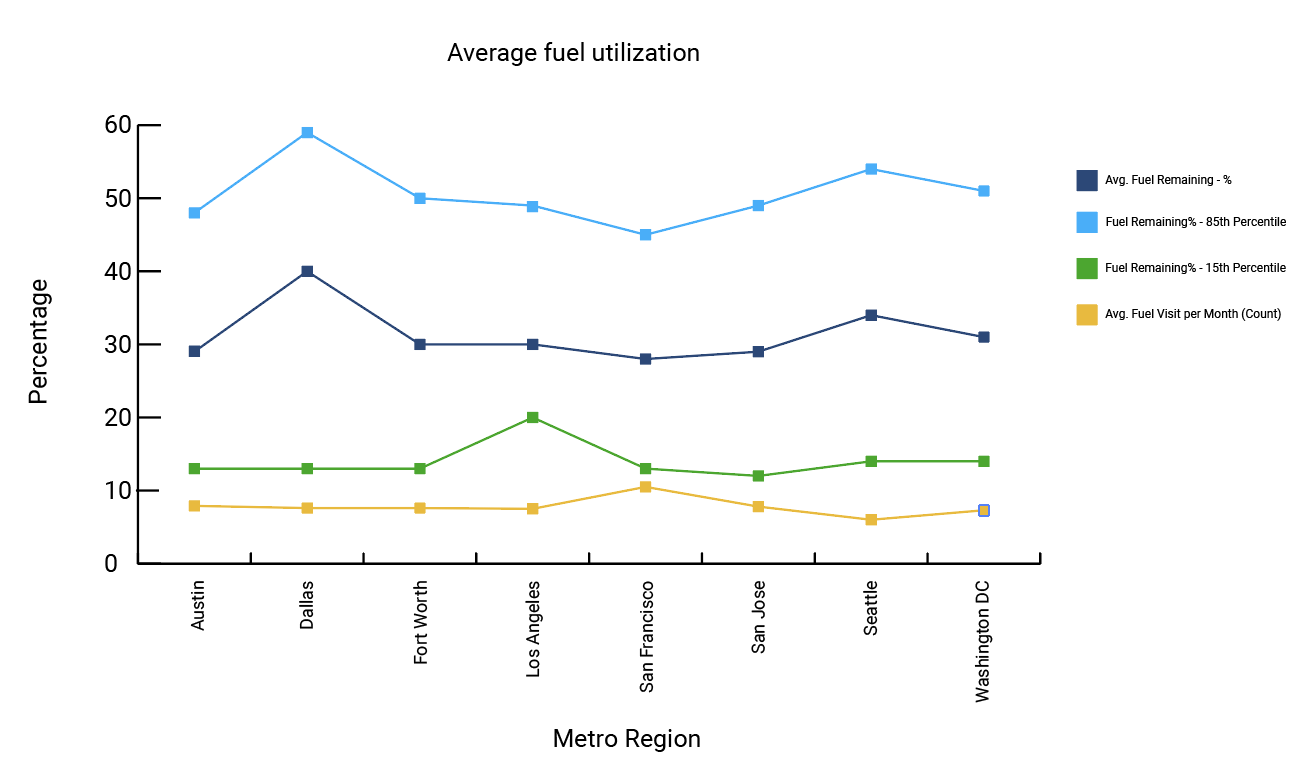
Average fuel utilization
With drivers going to the gas station an average of seven times per month and with one-third tank of gas left, drivers are making more trips to the gas station than necessary. This study also showed that 85% of vehicles go to the gas station with half a tank of gas remaining.
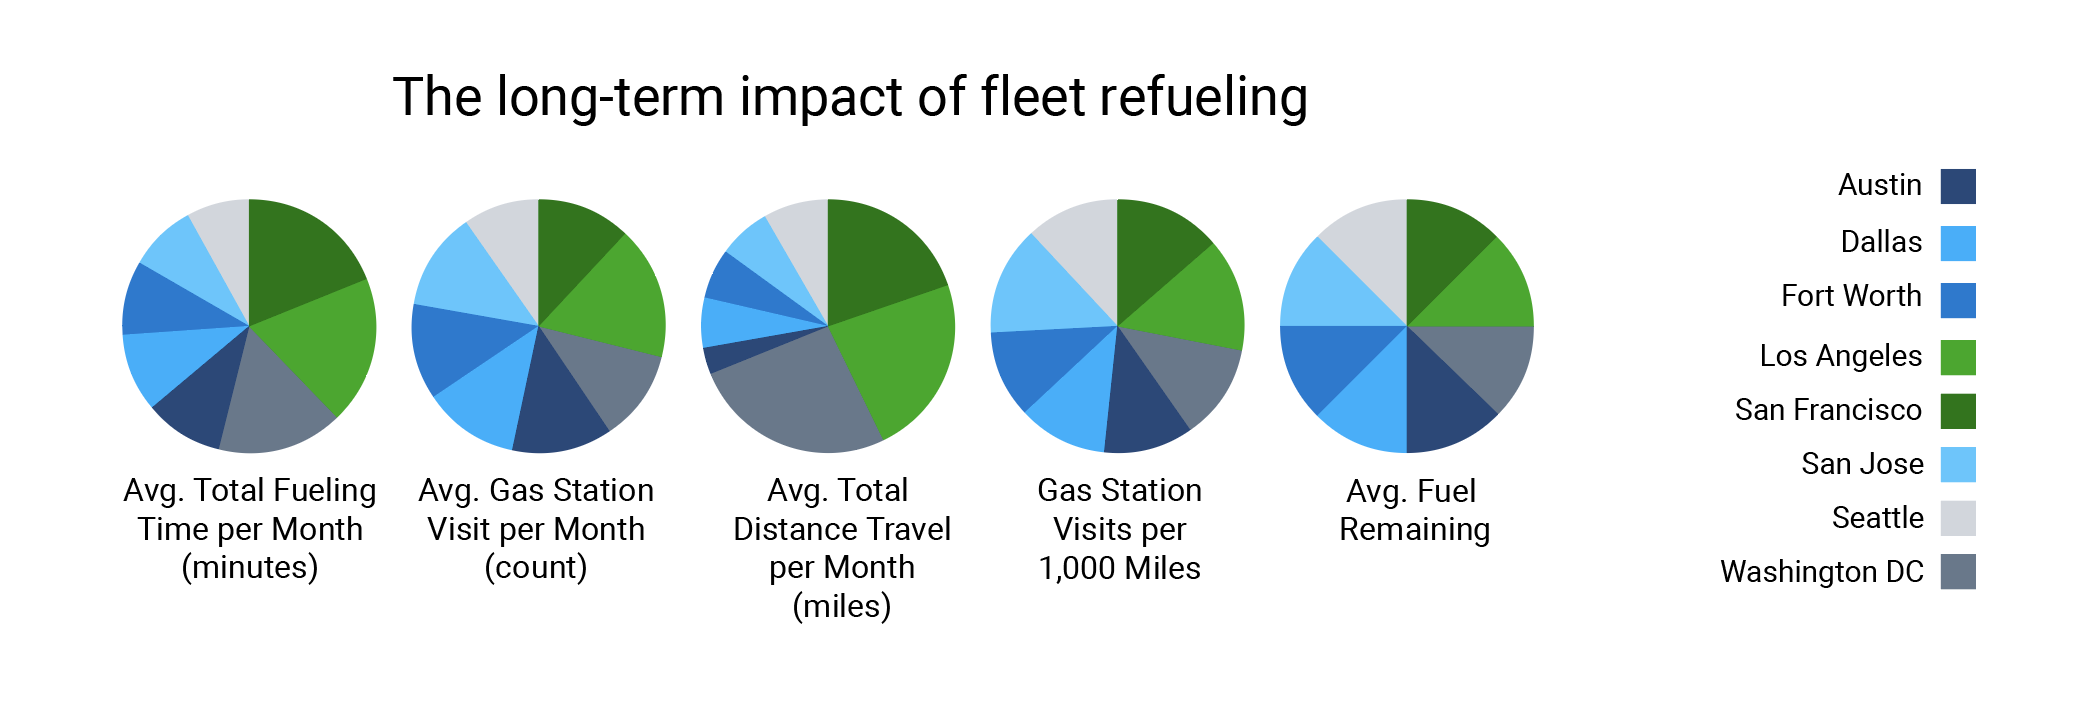
The long-term impact of fleet refueling
ORT and SDT make the Total Trip Time to the gas station more than a quick errand. It is the cause of two or more hours of non-productive time a month, on average. The additional miles driven have significant ramifications, not only on vehicle wear and tear but on our environment.
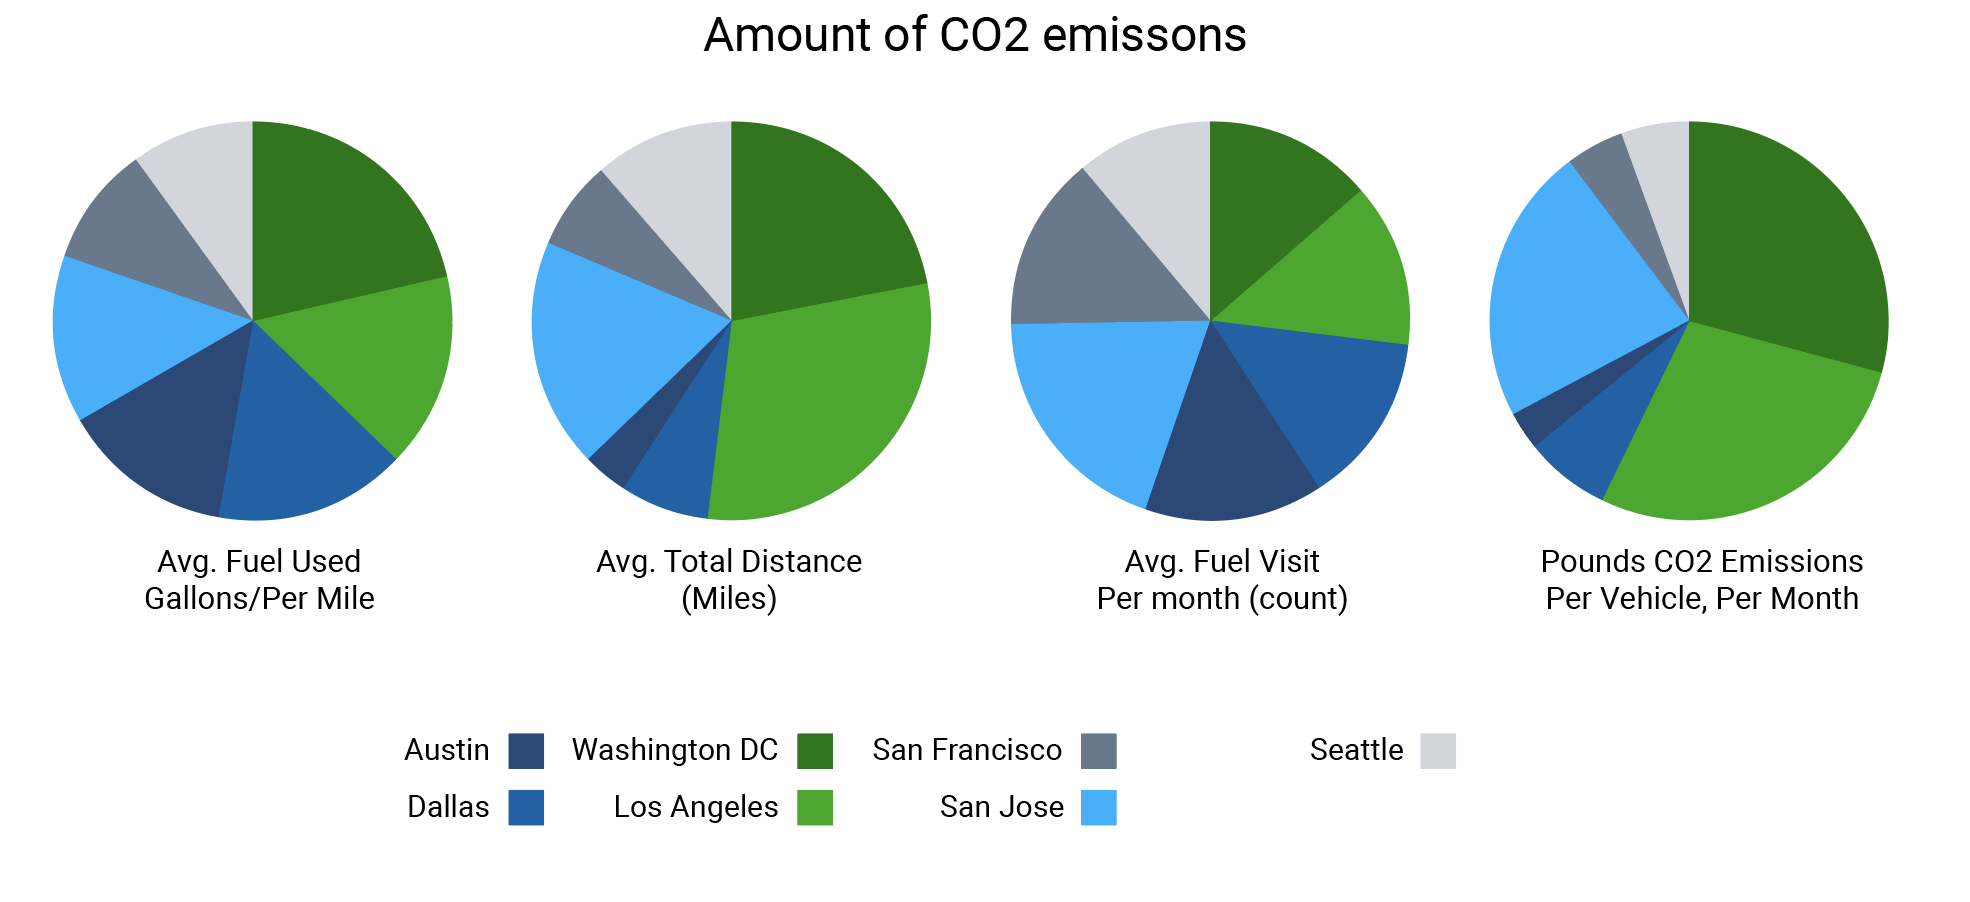
Amount of CO2 emissions
Refueling also impacts fleet sustainability. Each off-route refueling trip added an average of 3.45 pounds of CO2 monthly. In our analysis, the city with the highest amount of CO2 output is Los Angeles with 7.06 pounds released monthly by fleet vehicles in the study. This means a 20-vehicle fleet in Los Angeles is adding an additional 74 metric tons of CO2 into the atmosphere, the equivalent of burning 813 pounds of coal.
Study findings
The deep analysis of this common task uncovers the cost of off-route and inefficient refueling practices to both businesses and the environment.
The time required to get to the gas station, pay, refuel and get back on-route in addition to the number of essential and non-essential fuel stops is significant. Overall, current refueling practices are a place for potential optimization.
How to manage fleet fuel costs
Managing fleet fuel costs doesn’t have to be complicated. As this study has shown, many drivers are refueling earlier than necessary, and as a result, are burning more fuel in the process. You can manage fuel costs associated with off-route fill-ups by:
- Optimizing routes to bring drivers closer to fill-up locations
- Setting reminders or alerts for fill-ups when the fuel gauge reaches a certain level
- Avoiding idling when making fuel stops
- Monitor fuel economy trends through telematics
- Use a fleet fuel management system
For more ideas on how to manage fleet fuel costs, read our article: 12 tips to cut down your fleet fuel expenses.
How to save fuel
According to the U.S. Department of Energy, when the engine is warm and at its most fuel-efficient temperature, shorter journeys can use twice as much fuel as a single long, multi-purpose trip covering the same distance. To save fuel, plan your routes ahead so that less off-route travel has to occur to get to a gas station.
For more tips on driving efficiently, you can also read our article: 8 Eco-driving tips to save fuel.
Conclusion
Take a closer look at your fleet refueling practices to find ways to save.
To learn more about managing your fuel costs, visit our fleet fuel management web page. To see what others are saying about fuel management, visit the Geotab Community.
Subscribe to get industry tips and insights
The Geotab Team write about company news.
Table of Contents
Subscribe to get industry tips and insights
Related posts

Maintenance log template: How fleets track repairs, stay compliant and cut costs
June 3, 2026
5 minute read


Why field service routing decisions are costing you more than fuel (and how to fix it)
May 14, 2026
4 minute read
Why maintenance scheduling for fleet assets requires more than a calendar
May 7, 2026
5 minute read