Top 10 KPIs to drive more efficient fleet maintenance management
Looking to enhance the efficiency, safety and service life of your fleet vehicles? Effective fleet maintenance management practices are essential to achieving these goals.

Creating a new set of fleet efficiency goals and fleet maintenance key performance indicators (KPIs) is a great way to keep your business current and track its progress throughout the year. By setting meaningful fleet maintenance KPIs, you can get a head start on fleet maintenance management and running a safe, productive fleet.
Let’s review some fleet efficiency goals and metrics from a vehicle maintenance and repair perspective.
Fleet asset utilisation rate
Setting ambitious goals for fleet asset utilisation and minimising downtime will help set you on a strong path to success. If your fleet vehicles are in top mechanical health, you have the best odds of meeting these goals. Your utilisation goal should be 95% for this metric.
To calculate your fleet productivity, use this formula:
(Total Hours Worked) / (Work Hours less Lunch, Breaks or Meetings, Downtime like traffic) = Productivity Score
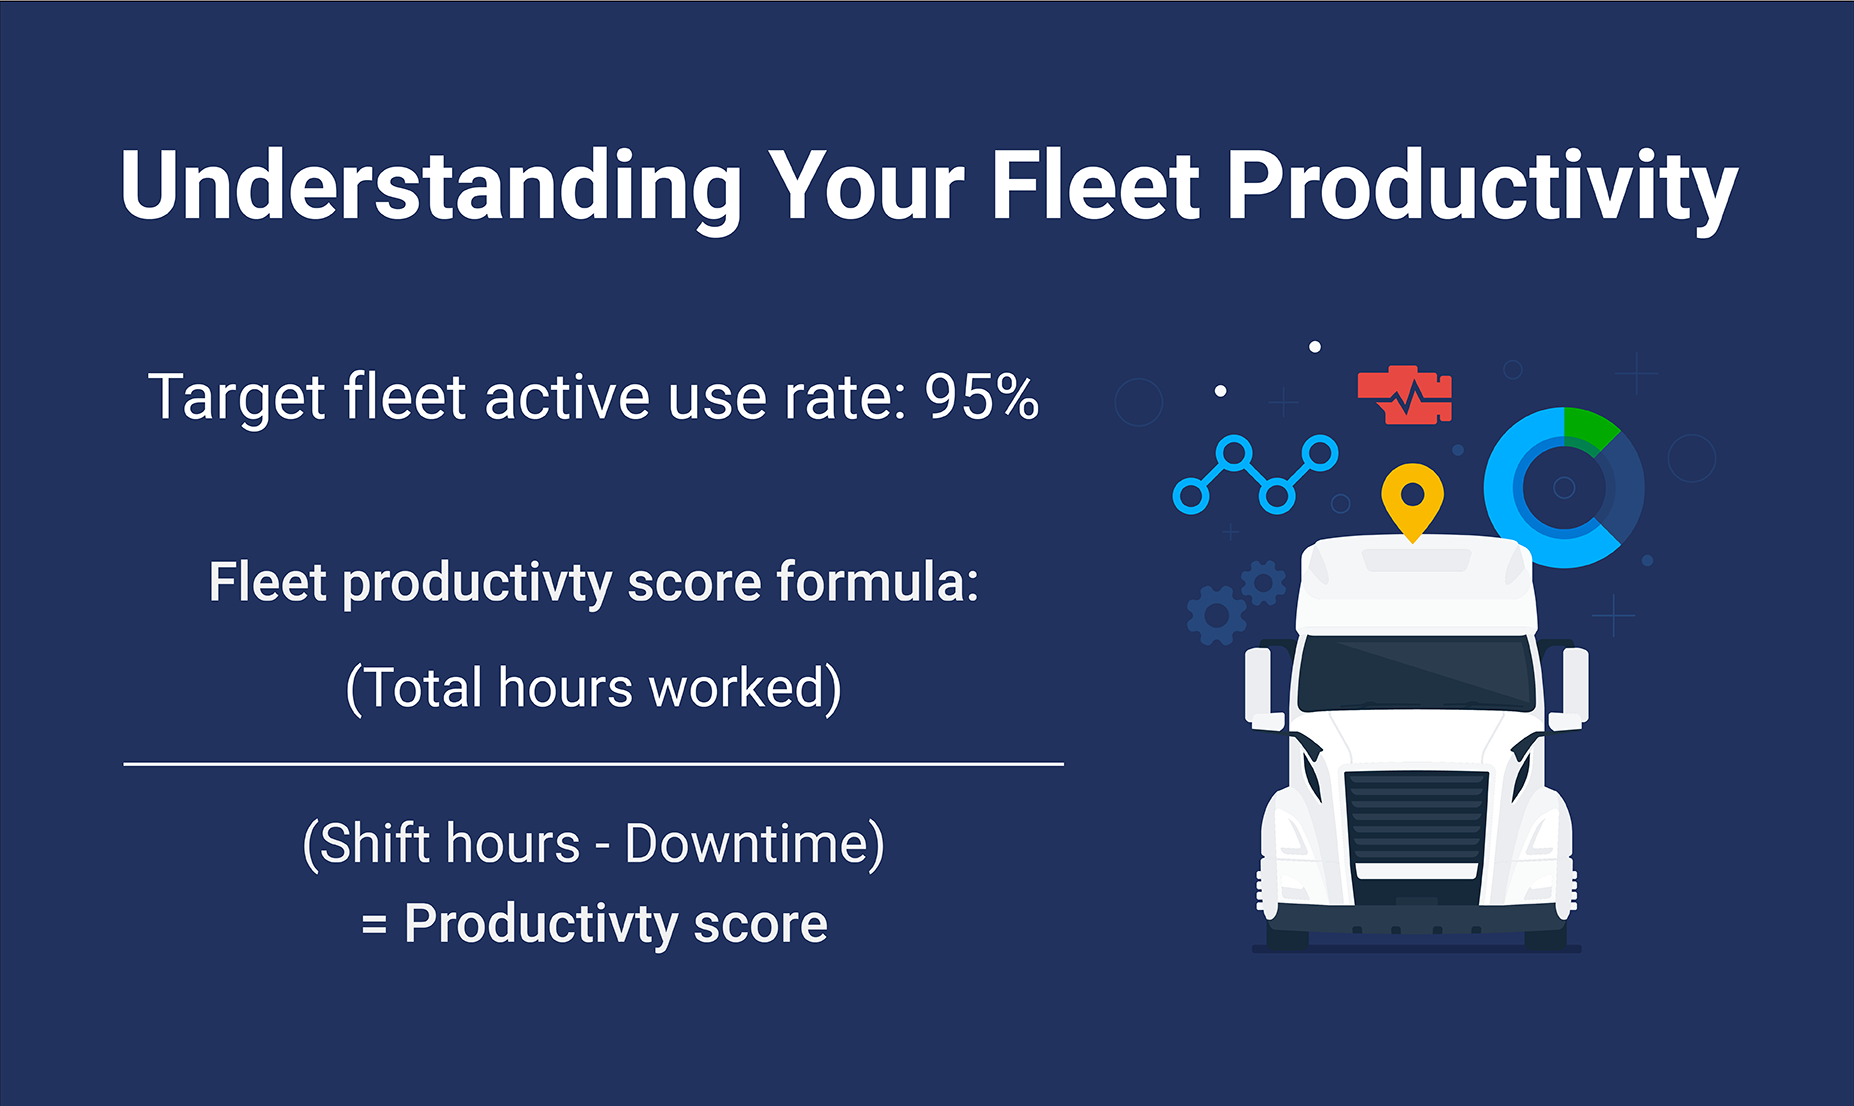
Fleet productivity formula
How to calculate fleet productivity
Target active fleet use rate: 95%
Fleet productivity score formula:
(Total hours worked) / Work hours - Downtime) = Productivity score
How can you achieve the optimal active on-the-road operation rate? If you check your vehicle status daily to determine your status, it will help you take proactive action to hit this number. The best time to check this score is in the morning.
Managing downtime ranks among a fleet manager’s primary concerns. Learn how fleet reports for tracking trips and visits can help in this blog post on how to measure fleet productivity.
Preventative maintenance frequency
Scheduling and completing vehicle maintenance requirements on time is critical to maintaining your fleet safety and active operation levels. Leading telematics systems can identify mechanical problems through engine fault codes and other sensor readings even before a driver realises there is an issue.
Preventive maintenance (PM) service records are critical for a number of compliance requirements. Formal vehicle maintenance and safety policies can instill confidence about when it’s time to schedule vehicles for maintenance like oil changes, services, brakes, and tire replacements. Predictive maintenance helps reduce vehicle wear and tear, and it decreases the likelihood of breakdowns and major repairs.
Fleet managers can support efficiency by establishing policies and standards that:
- Require that vehicles are serviced with manufacturer-approved parts, and at specified service, locations to avoid warranty issues and prevent mechanical failure.
- Standardise payment methods, pricing authorisation levels, and emergency reimbursement policies. It fosters employee trust and empowers them to make a range of decisions about what’s best for your vehicle.
- Specify whether maintenance is scheduled based on time, mileage, or a combination of the two. Help your drivers to plan for maintenance and minimise disruption.
Knowledge of fleet maintenance policies should be tested frequently. Clearly outline processes and keep documents up-to-date to encourage compliance.
Maintenance technician productivity and efficiency scores
Ask these questions to help understand the productivity and efficiency of your maintenance operations:
- Are your maintenance and repair costs assigned to multiple departmental cost centers?
- What are your current trends related to billable productive hours, considering sick time and paid time off?
The ideal productivity score is 70%. If productive times exceed that percentage, there may be something wrong with your calculations.
Technician efficiency (active working ratio) should be around 90%. It’s important to balance the size of your fleet maintenance team against the maintenance and repair needs of your vehicle and equipment inventory. Staff your team with technicians that understand the modern heavy- or light-duty vehicle maintenance requirements and electronics.
Repeat repairs percentage
Is your fleet service center monitoring your repeat repairs on the same vehicle? Are similar vehicles off the road for common mechanical problems? Your goal should be to have less than 3% repeat repairs. If you have a higher number, find out why by checking for vehicle recalls, or talking to technicians about the parts and techniques they are using.
Scheduled maintenance and repair work
This metric aligns with your PM goal. To run a successful fleet, the scheduled work goal should be 60%. If you are experiencing a spike in unscheduled repairs, take a look at your PM metrics. Look for ways to enhance your communications with your drivers or clients, such as providing more detailed instructions or by checking in more often. Scheduled maintenance appointments lessen the risk of critical maintenance requirements being missed and causing expensive repairs.
Reduce EV breakdowns and reduce cost and waste
Check out Geotab’s new Electrical Systems Rating (ESR)Report to determine your fleet's battery health. Prevent on-road breakdowns while decreasing your unscheduled repairs ratio. The Electrical System Rating or ESR is a rating that measures the health of a vehicle’s electrical system on a scale from 0 to 100.
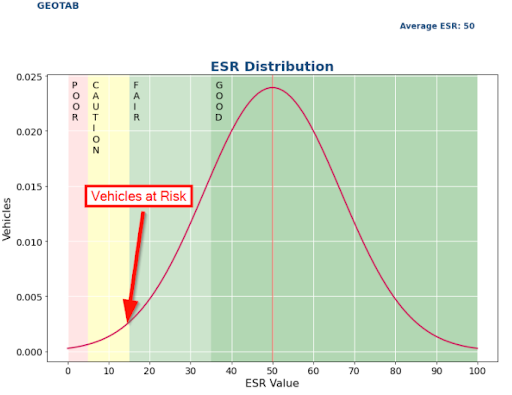
Electrical Systems Rating Summary
Parts availability
Contract out your parts inventory management processes if you can manage it. Having in-house inventory is costly and unused parts can become obsolete. Outsourcing will not only increase your parts availability rate, it can also be a smart financial move. Third-party companies can bear the cost of storing and distributing parts for you. You can always ask them to increase inventory without having to pay on your own.
The ideal metric for this goal is to have 80% of parts in stock, 90% in two hours and 98% for one-day availability.
Idling time
MyGeotab offers a highly efficient way to follow and manage this behaviour, and related costs. It is a difficult rule to regulate otherwise. If your drivers are idling often, this translates into high fuel costs, increases your carbon footprint, and increases labour hours to maintain that fleet along with higher maintenance costs.
The Geotab idling report — one of the many productive fleet benchmark reports available to help optimise your fleet — will help you hit your target to stay at less than 5% idling per vehicle.
Vehicle maintenance completion rate
How long does it take to get the vehicle in and out of your shop? To set realistic expectations, you should assess maintenance downtime on a per-class basis, such as specialty utilities versus passenger cars. There would also be priority vehicles, such as patrol vehicles, that would need to get out faster than others.
Ideally, your target metric should be to complete 90% of maintenance work within 48 hours. You should consider taking vehicles with more complex repair requirements to a certified dealer service centre for repair.
Customer and employee satisfaction
What tools are you using to monitor and understand your customer satisfaction rate? Have you considered conducting online or phone surveys? Maintaining high customer satisfaction scores and conducting surveys can help catch and resolve outstanding issues. A 90% customer satisfaction goal is key to running a successful fleet. The same is true for driver-employee satisfaction.
Cost per km operations and maintenance
Maintenance and repair costs for utes and cars vary widely based on the vast range of vehicle and fuel types. The more kilometres vehicles are driven, the lower cost per km will (or should) be. You will need to measure your cost per km per class basis, look for the outliers and constantly measure and improve this metric over time. Geotab’s telematics data will help you keep records of these measurements while helping you improve over time. You may also want to consider adding the total cost of ownership metric to your fleet maintenance KPIs and goals.
Consider implementing some of these additional goals and fleet management KPIs when running your fleet:
- Inventory turns year over year
- Employee satisfaction rate
- Kilometres per litre
- The total cost of ownership
- Driver behavior (harsh turning and braking, speeding)
- Warranty recovery rate and savings
Streamline fleet maintenance and maximise uptime with the Marketplace
Balancing your vehicles’ mechanical needs with your employee and customer satisfaction can be challenging. By establishing some fleet goals and metrics to monitor your performance, your fleet managers can do their best work. These metrics can help keep your vehicles on the road and compel your drivers to adopt safe driving habits.
Try following industry best practices by setting and tracking fleet efficiency goals and metrics that are Specific, Measurable, Achievable, Relevant, and Time-Bound (SMART).
Start exploring your options. Visit our Marketplace maintenance and diagnostics solutions to help track your vehicles and improve your fleet maintenance management processes.
The Geotab Team write about company news.
Table of contents
- Fleet asset utilisation rate
- Preventative maintenance frequency
- Maintenance technician productivity and efficiency scores
- Repeat repairs percentage
- Scheduled maintenance and repair work
- Reduce EV breakdowns and reduce cost and waste
- Parts availability
- Idling time
- Vehicle maintenance completion rate
- Customer and employee satisfaction
- Cost per km operations and maintenance
- Streamline fleet maintenance and maximise uptime with the Marketplace
Related posts
.jpeg)

Geotab becomes a certified Telematics Monitoring Application Service Provider
April 1, 2025
3 minute read

Geotab at MEGATRANS discusses Cost Savings and Automation
September 24, 2024
1 minute read

Telstra 3G Shutdown Extension gives Fleet Managers more Time to Upgrade
May 10, 2024
2 minute read
