Accidents happen
According to the DOT, 317,000 large trucks were involved in traffic crashes In the U.S. Telematics accident data can be used to analyze accidents.
By Geotab
Mar 2, 2022

In the United States, there were 317,000 large trucks involved in traffic crashes during 2012, according to the U.S. Department of Transportation. Amongst these:
- 65% of accidents involving two vehicles were front impact collisions
- 17% left side
- 12% right side
- Only 6% rear impacts
- & 46% of these crashes involve both vehicles proceeding straight
These numbers suggest that the crashes have cost these organizations large sums of money - both in vehicle damage and personal injury. However, the vehicle or truck driver may not be at fault, and opportunity to avoid costly repair and insurance fees may exist. One of the best ways to re-create a trip and accurately uncover what occurred, second-by-second is to leverage telematics technology.
While the aim of using telematics is to avoid accidents from occurring by being proactive in the first place, such as by improving driver behavior - the bottom line is that accidents can still happen. Even the most careful and best drivers can find themselves in an unexpected on-road predicament. But the key thing to note is that an accident doesn’t always have to impact your bottom line. With the use of MyGeotab, a world leading fleet management software used by businesses of all sizes, business owners and fleet managers can use the tools available to instantly analyze accidents.
Reports and Data
Looking at the map and trips history report has typically been a traditional form of looking at an event. However, there are more tools that provide insight for various occurrences...from point of impact to acceleration graph.
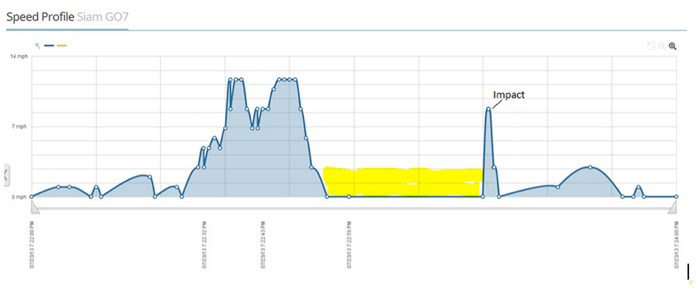
Point of Impact Chart: This is a speed profile chart that shows the speed of the vehicle during the time of the accident. In this case, the yellow section indicates the vehicle was stopped before the point of impact.
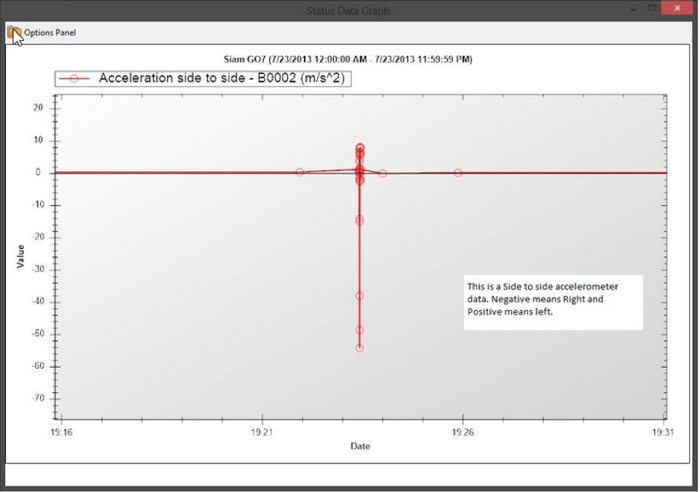
Acceleration Graph: This is a side-to-side acceleration graph. In this case, negative represents right. The graph shows the vehicle accelerated to the right at the point of impact, thus it was hit from the left side.
Engine Data
The data from the device after the accident can also be used to assess the damage of the internal system. The key here is to look for Engine Fault Codes. These codes will refer to issues in the vehicle reported by the engine computer. Anything from transmission issues to ABS (Automatic Braking System). Furthermore, engine status data can also be used to determine issues with the vehicle. For example an increase in coolant temperature can indicate possible coolant fluid leaks or damage to the engine. Engine status data is displayed under Engine & Maintenance within MyGeotab.
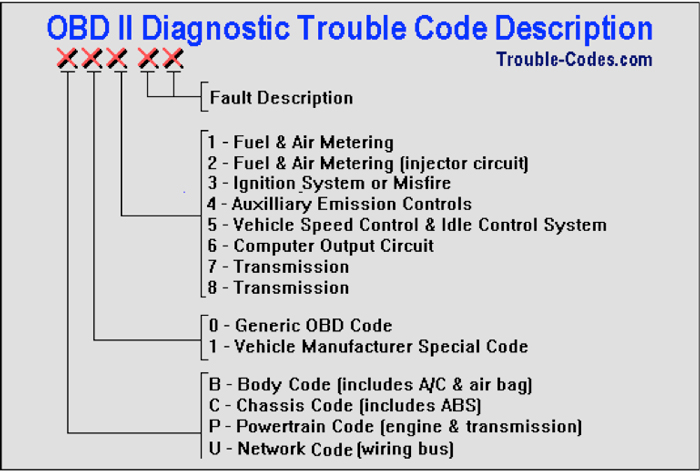
For a full description of engine fault codes, refer to the specific vehicle manual or manufacturer.
Find more details on telematics accident data and accident reconstruction here.
Subscribe to get industry tips and insights
Geotab team
Table of Contents
Subscribe to get industry tips and insights
Related posts

Unified data: The key to fleet liability reduction for government agencies
March 19, 2026
9 minute read


Building a coaching culture: How to end the ‘gotcha’ game in your fleet
March 4, 2026
3 minute read


The Simple Truth: Why Rewarding Safe Driving is Your Fleet’s Smartest Business Decision
February 25, 2026
4 minute read