8 free custom fleet management reports
Geotab has just added 8 new convenient and time-saving custom fleet management reports to provide businesses with actionable data.


Reporting is an essential element of fleet management, but finding time to set up reports can be challenging. With this in mind, Geotab has added eight new custom fleet management reports to provide businesses with actionable data.
As a Solutions Engineer at Geotab, part of my job is to ensure fleet managers have the tools they need to effectively manage and improve fleet efficiency, productivity, and safety. The report templates in this post were custom-designed to do just that and are available for free on the Geotab Marketplace.
To learn how to import a report into MyGeotab Fleet Management Software, watch our Reporting Basics video on YouTube.
See also: The Watchdog Report: Maintaining a healthy fleet
New custom fleet management reports for the MyGeotab platform:
- Telematics Device Issue Detection Report
- Watchdog Report by Minute
- Dynamic Vehicle Maintenance Reminder
- Fuel Cost Analysis Scorecard
- Average Fuel Economy (L/100km) (MPG US), (MPG IMP), (KML)
- CO2 Emissions Fleet Management Report
- Mobileye Weekly Trending Scorecard
- Exception Detail Report with Trips History
Health and diagnostics custom reports
Check the health of your telematics devices and fleet vehicles with three new reports.
Telematics Device Issue Detection Report
Detect device-related issues to ensure a strong telematics device uptime in your fleet. It includes a breakdown of exactly which devices are experiencing performance issues, what those issues are, and how they can be addressed in order to restore normal device functionality.
This fleet management report details:
- Device performance issues
- Fault type
- Troubleshooting tips
Watchdog Report by Minute
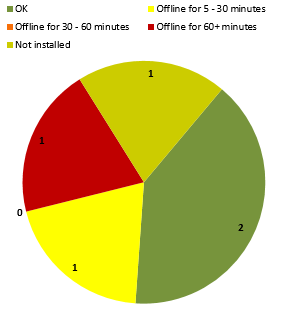
Keeping track of telematics device health is an important task that’s often overlooked. Manage device uptime with the Watchdog Report. Devices are tested throughout the day to ensure they are communicating via the cellular network and accurately recording trips made by fleet drivers and their vehicles.
This version of the Watchdog Report allows you to monitor communication status minute by minute as compared to the default report. See which devices have been offline for 5-30 mins, 30-60 mins, and 60+ mins. The email setting makes it possible to have this fleet management report sent direct to your inbox when device communication is delayed longer than 5 minutes.
Special features:
- Simple to read and understand
- Built-in conditional email reporting function
- Multilingual support
Dynamic Vehicle Maintenance Reminder
Fleet managers focused on maintenance planning and asset utilization will appreciate this custom fleet management report. Stay informed on which vehicles have upcoming service needs with the Dynamic Vehicle Maintenance Reminder. Receive email reminders of service due, according to set rules for Due Date, Due Distance, or Due Engine Hours.
Report features:
- Logic included for dynamic email sending
- Customizable maintenance due parameters
- Applicable to all reminder types

Fuel savings custom reports
Boost your fleet’s fuel efficiency with these custom fleet management reports that look at the cost of fuel and your fuel economy per fill up.
Cost Analysis Scorecard
See how driver behavior is impacting the total cost of operation (TCO) of your fleet. This is a great report for fleet managers who are focused on driver training and fleet optimization. Results can be shared with drivers to help them understand and improve their driving habits behind the wheel.
Idling and aggressive driving have a direct impact on total cost of operation. Idling burns roughly 1 gallon of fuel per hour and vehicles which idle more than 50% of their on time experience higher maintenance costs. Increased maintenance costs are also associated with aggressive driving behavior.
The Cost Analysis Scorecard summarizes a number of key fleet metrics:
- Idling Duration & Cost
- Total Distance, Drive Time & Stops
- After Hours Trips
- Harsh Acceleration, Harsh Brake, and Harsh Cornering Count
- Speeding Time & Cost of Speeding
- No. of Tire Wearing Events & Additional Tire Maintenance Costs
- Total Driver Behavior Costs
- And much more
Costs are based on USD currency, and the report provides gallon or litre options and customizable cost inputs. The graph display allows fleet managers to quickly analyze and understand the data.

Average Fuel Economy Report
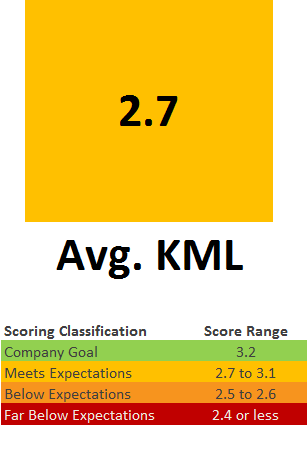
An essential fleet management report for those looking to decrease their total fuel costs. Reducing fuel expenses can lead to a more efficient and profitable business operation. This report provides an easy-to-understand visualization of the average fuel economy for your fleet based on either liters per 100km (L/100km), MPG US, MPG IMP, or KML.
Report features:
- Easy to interpret
- Great candidate for dashboard reporting
- Fuel trending analysis over time
CO2 Emissions Report
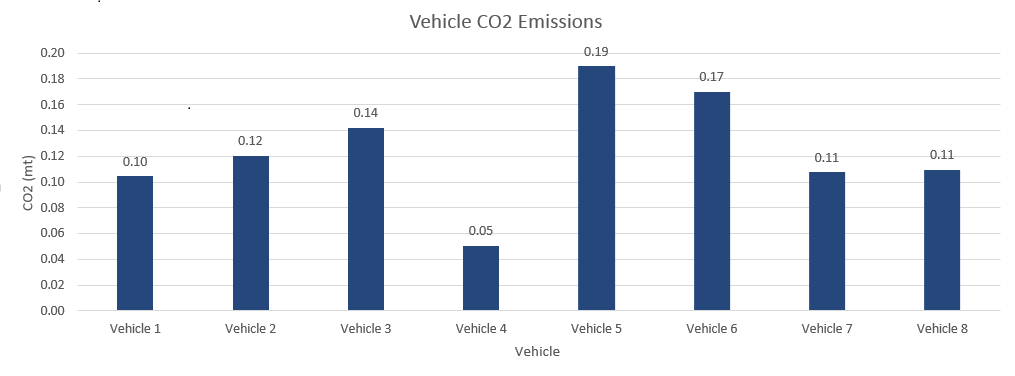
Decrease your fleet’s carbon footprint with the CO2 Emissions Report. Reducing CO2 emissions not only contributes to corporate sustainability efforts, but also leads to a more efficient and profitable business operation.
This report uses engine-based fuel economy data to calculate the estimated amount of CO2 emissions as a result of fleet activity. It is available in an easy-to-read chart or graph format, and supports all relative units of measure.
Trips and exceptions
Understand your fleet better and faster with these time-saving, custom fleet management reports on driver safety trends and exceptions.
Mobileye Weekly Trending Scorecard
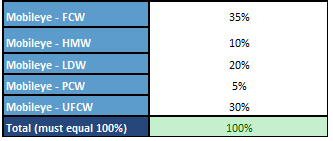
Enhance driver safety and asset management with the Mobileye Weekly Trending Scorecard. This custom report shows the scoring trend for each Mobileye user.
View driver risk score based on:
- Forward Collisions
- Headway Levels
- Lane Departure
- Pedestrian Collisions
- Urban Frontal Collisions
This report applies Mobileye rules to the Risk Management report in order to measure and log the number of warnings. The report takes into account the total mileage driven to normalize the events/100 distance units. The graphical display of scores over previous weeks allows for an easy visualization of driver trending behavior.
Exception Detail with Trips History
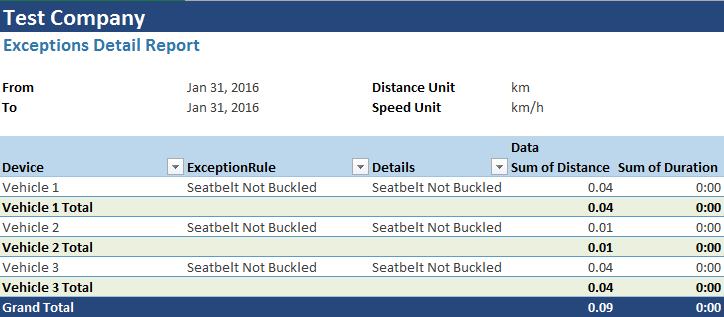
Investigate asset exceptions at a more granular level. Click on a link within the report sheet to directly open the exception’s trips history information. The exceptions list is customizable.
The Exception Detail with Trips History report is ideal for:
- Fleet managers who don’t have time to filter through the trips history data.
- New users to MyGeotab and users of all experience levels.
Find more MyGeotab custom reports on the Geotab Marketplace
Visit the Geotab Marketplace today to download these new custom fleet management reports and others. The Marketplace has over 25 custom reports to help fleet managers with fuel management, driver safety, Hours-of-Service (HOS) compliance, and more.
Related Posts:
Subscribe to get industry tips and insights

Tamara Bouchard is the Project Manager for the Geotab Marketplace
Table of Contents
Subscribe to get industry tips and insights
Related posts


How to avoid high downtime costs for construction fleets
March 10, 2025
2 minute read

Geotab Data Connector gets an upgrade for better fleet insights
February 24, 2025
1 minute read

Geotab: Unlocking value and enhancing K-12 transportation with data-driven fleet management
February 21, 2025
1 minute read
.png)
Marketplace Spotlight: Behind the Vision of Predictive Coach
January 30, 2025
1 minute read
