Sticker MPG vs measured MPG during winter months
The GO device runs several validation algorithms prior to reporting fuel to ensure that the most accurate source is utilized. Read more about the MPG report.
By Geotab Team
Aug 21, 2024

Through use of Geotab’s unique algorithms, the GO platform is able to report fuel usage on a majority passenger vehicles using a variety of sources described in a previous blog post titled Dude, Where’s my fuel.
With Geotab, you are automatically enrolled in quarterly firmware updates that will improve the quantity and quality of engine data parameters available. In every firmware release, there are incremental improvements to fuel usage support. For example, additional support for Hyundai and Kia vehicles are currently in the testing phase and planned for release later this year.
The GO device runs several validation algorithms prior to reporting fuel to ensure that the most accurate source is utilized. This is mainly due to the fact that fuel consumption sources vary by manufacturer. The current status of Fuel Usage support is published frequently under the heading “Current vehicle support” in the Geotab Product guide available within MyGeotab.
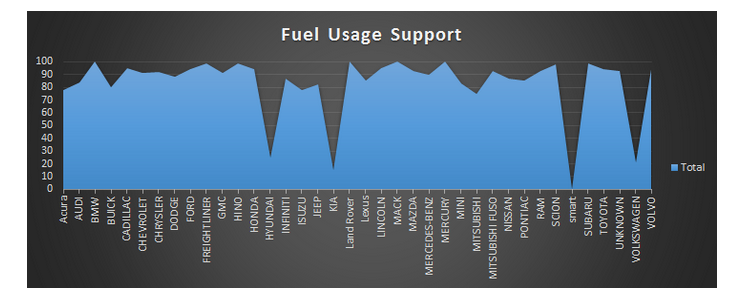
Source: Fuel Usage Support Graph, myGeotab Product Guide
Variances in Measured vs Expected MPG
In this article, we will review the MPG reported by the GO device compared with the expected MPG published on FuelEconomy.gov. Before diving into the graphs, it’s worth noting a few caveats.
- Vehicles that exceed 10,000 lbs are excluded from the graphs: MPG data is not provided by the EPA for vehicles greater than 10,000 lbs. [1]
- The trim level from the expected MPG (Sticker) and the measured MPG (Go Platform) may not match exactly. Data from FuelEconomy.gov was matched based on Make, Model ,Year, Fuel Type and Engine Size. There may be other variances in trim level that are not reflected in these parameters. As a result, there may be slight differences between the MPG on fueleconomy.gov and the Geotab Platform.
- Each graph only represents a select group of vehicles from each class, manufactured within the last 4 years. The graphs only displays vehicles that have reported MPG data using the Geotab GO Platform.
- There are many factors that affect MPG. Such factors include highway vs city driving, cold weather, variation in fuel blends and several others listed here.
- EPA reviews and confirms about 10-15 percent of the MPG reports provided by Manufacturers through their own tests. [2]
- The accuracy of fuel consumption sources vary by manufacturer. There may also be a difference in the degree of accuracy that the GO device is able to report, depending on the fuel consumption source. For example, the accuracy differs when the fuel consumption reading comes directly from the engine, or calculated based on the mass air flow sensor.
See also: How to improve your fleet’s fuel economy
Breakdown of Fuel Economy by Class
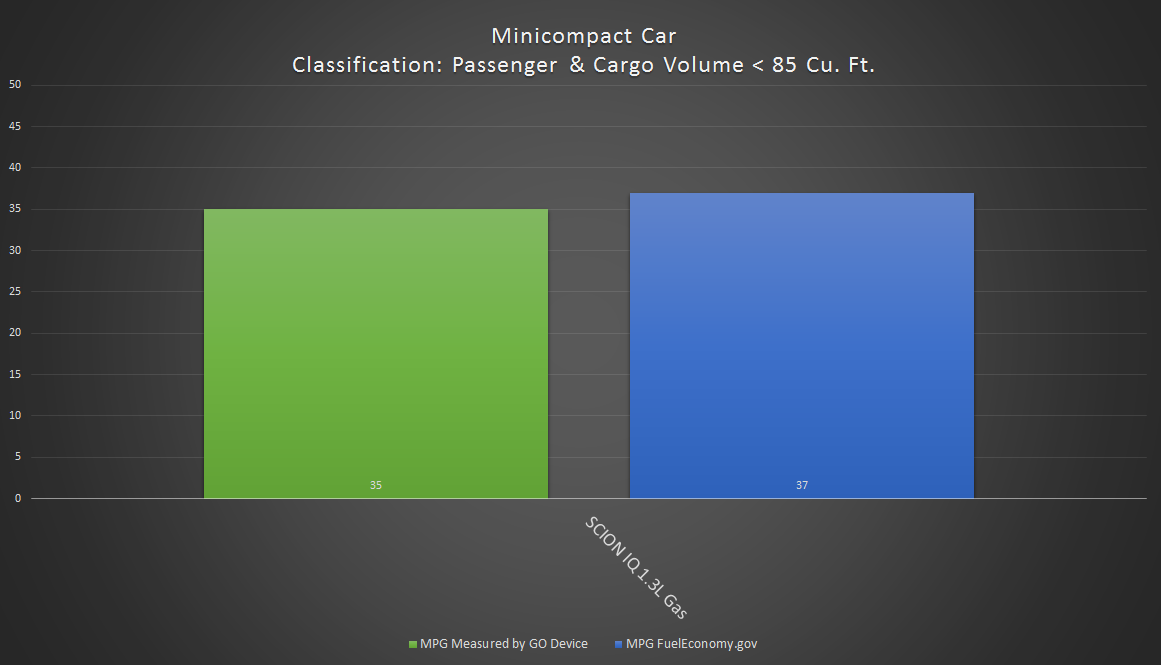
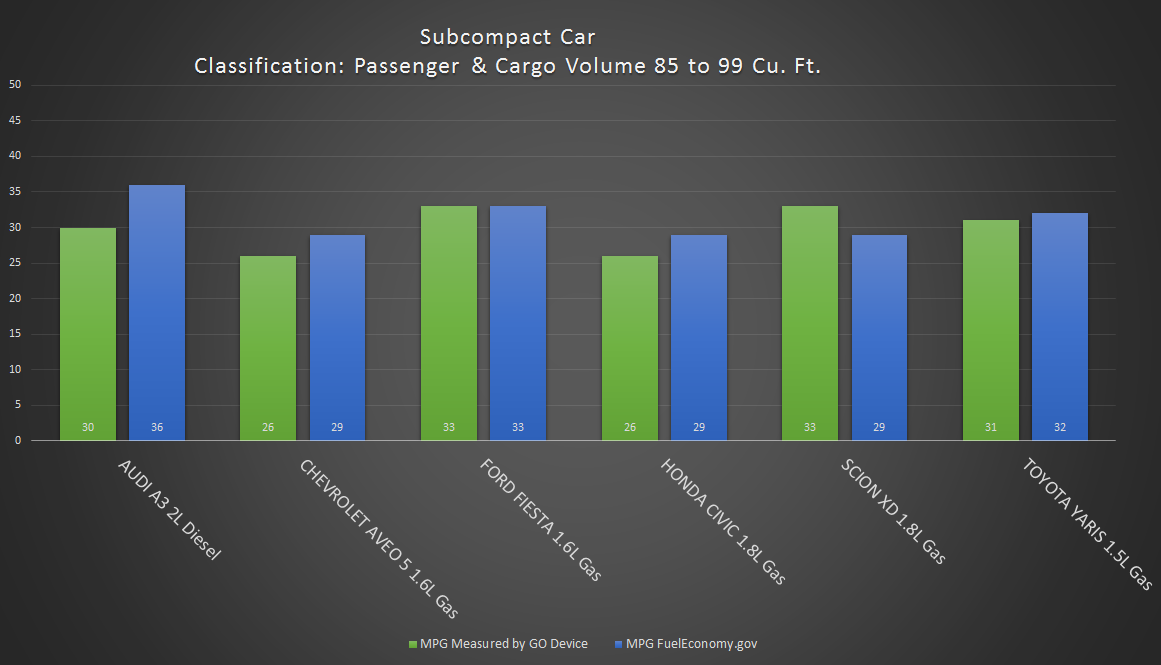
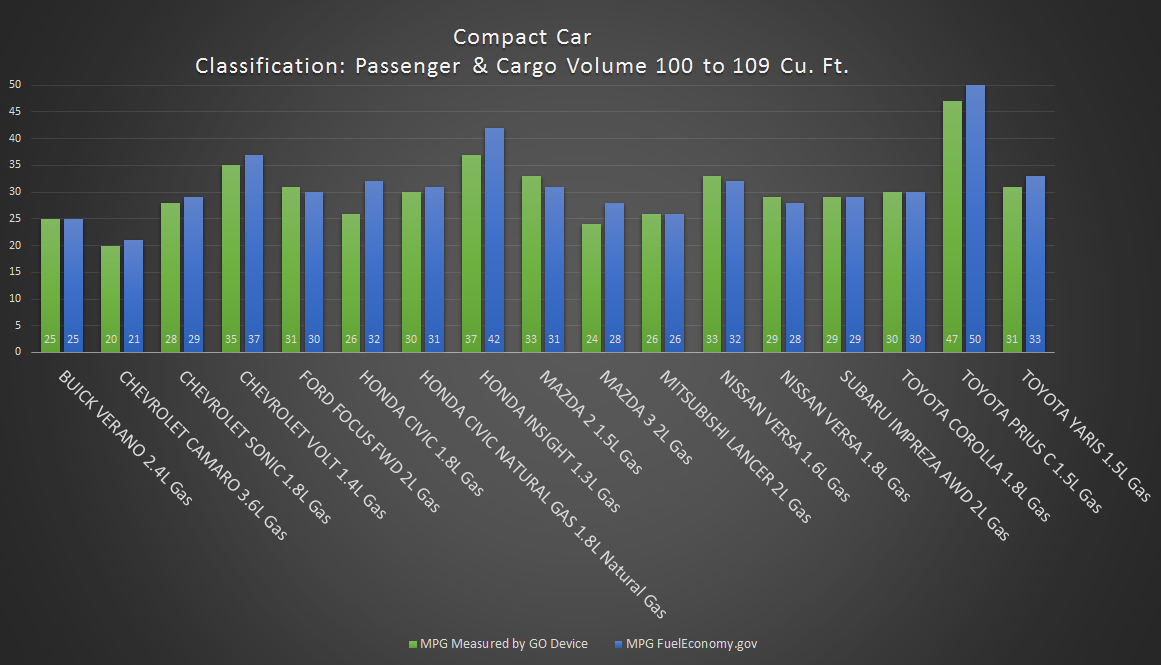
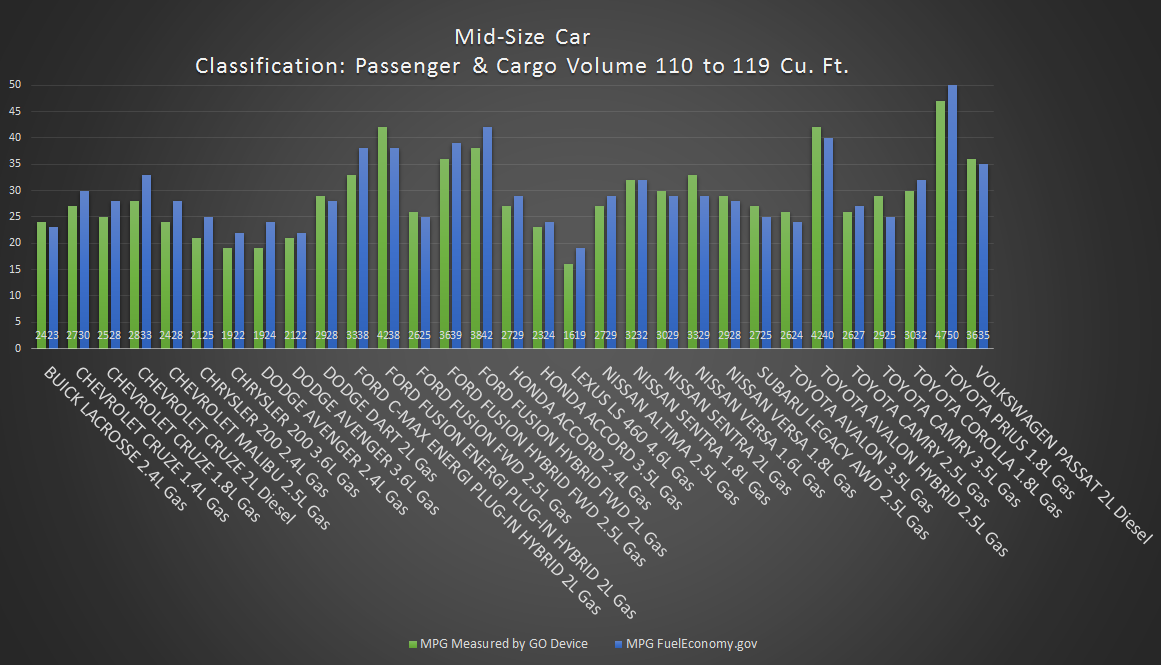
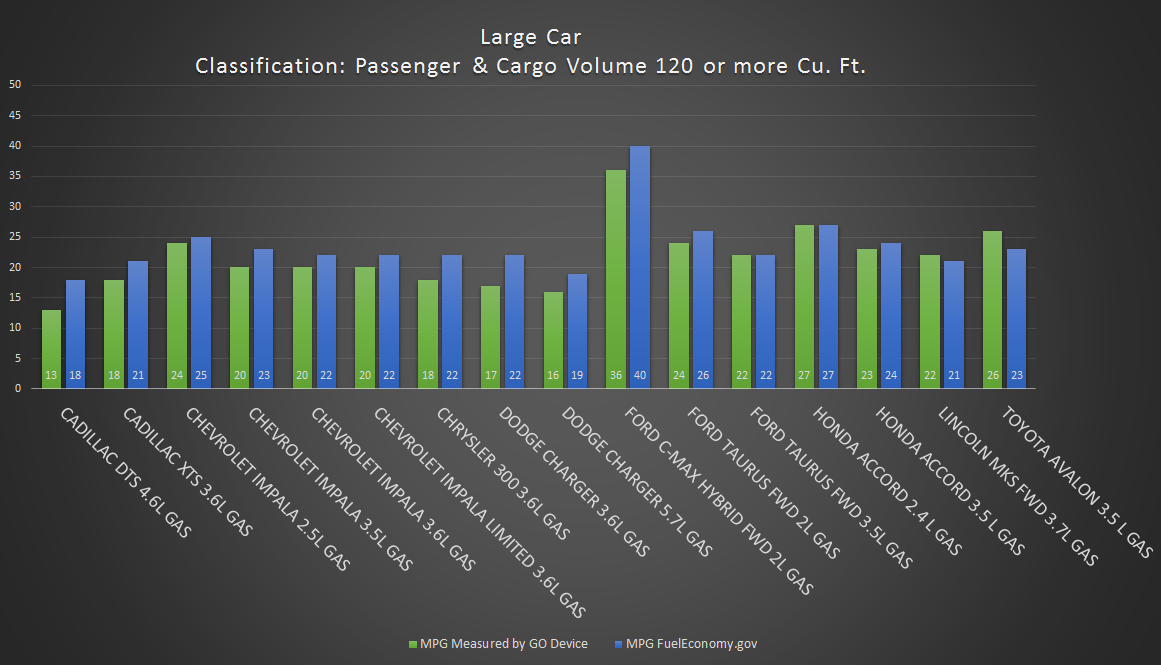
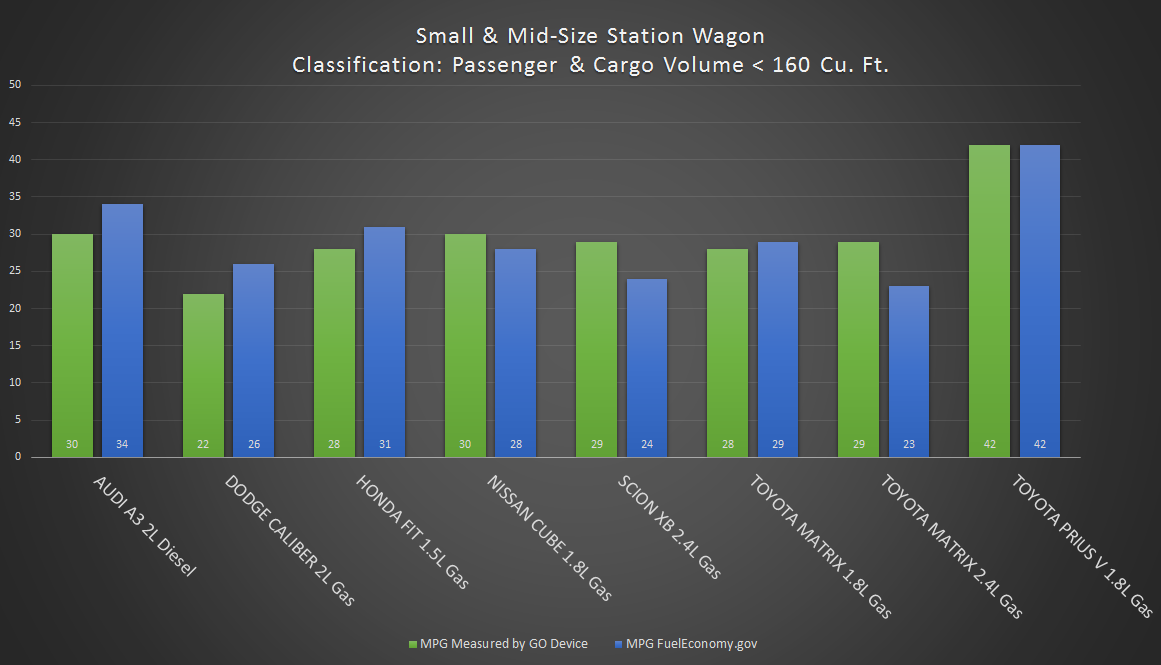
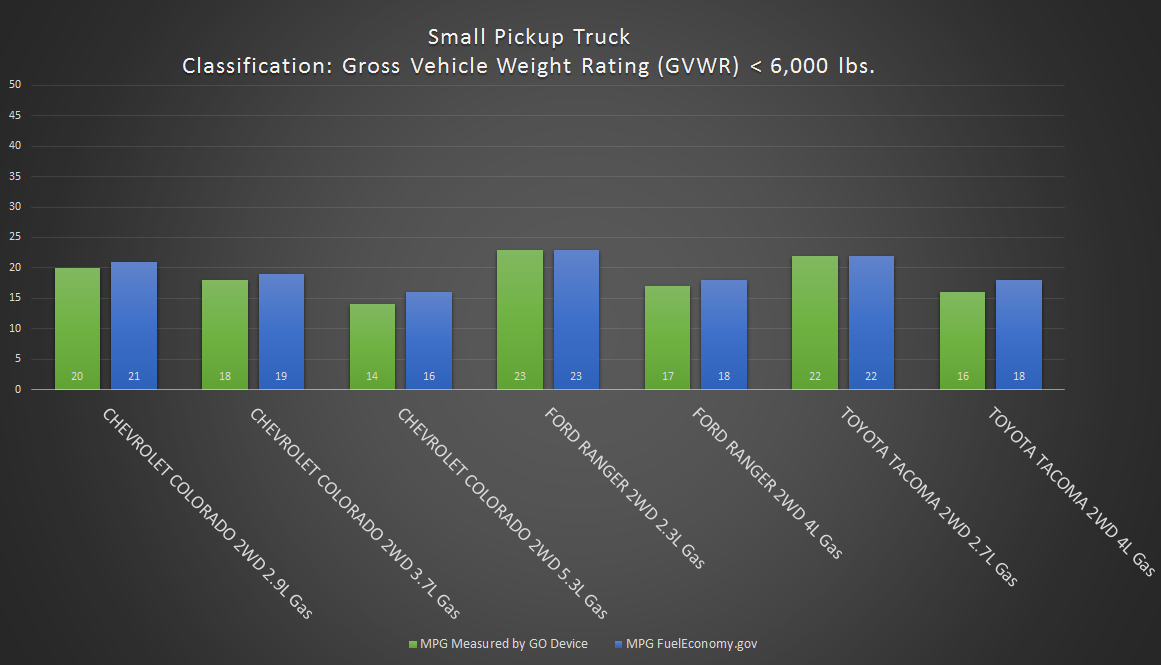
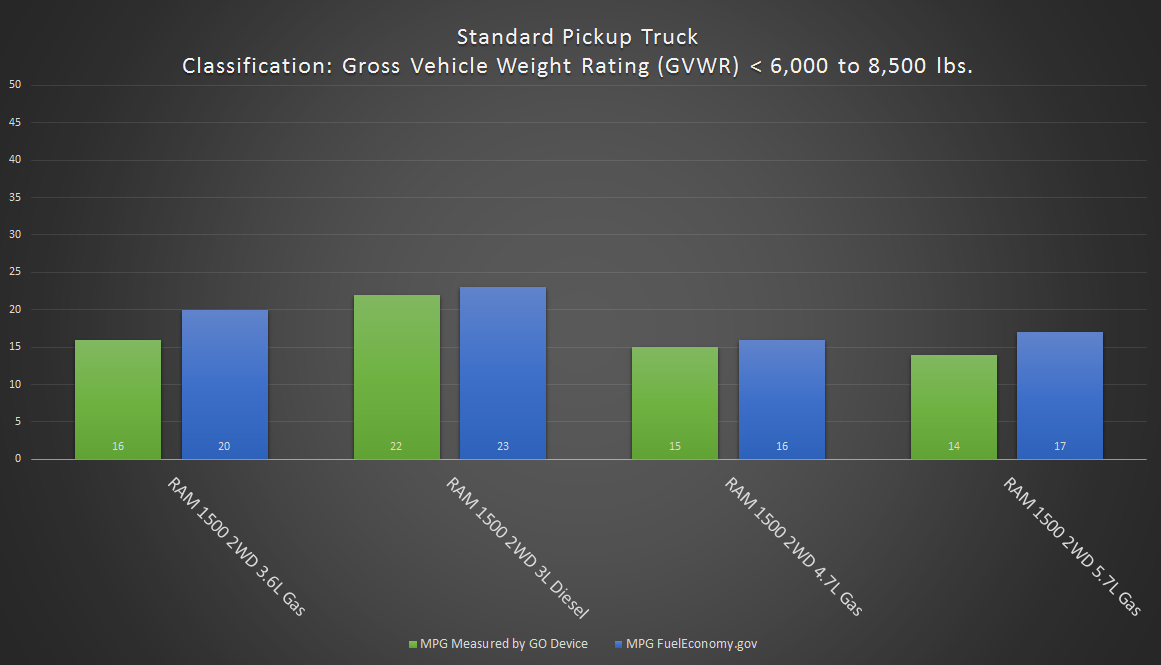
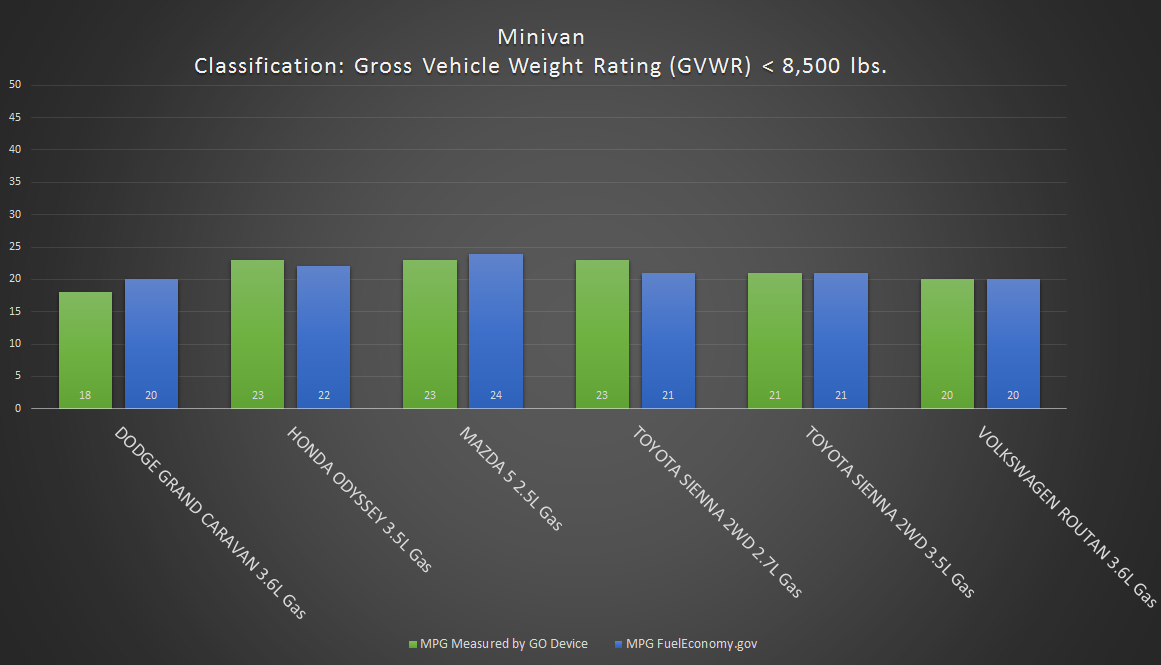
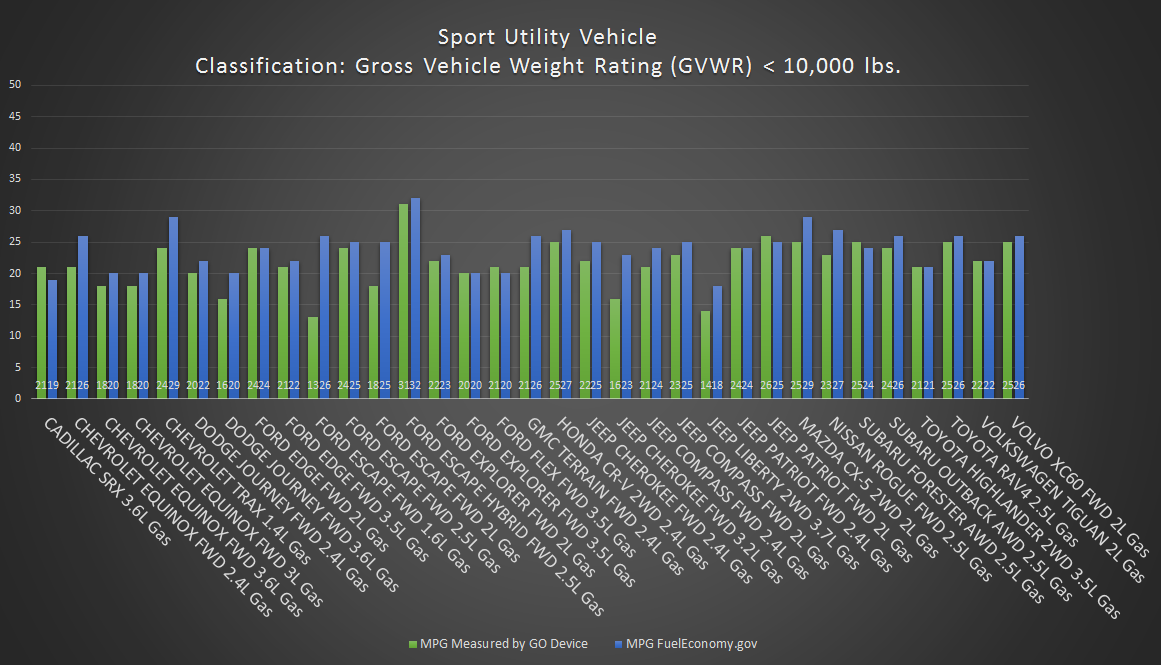
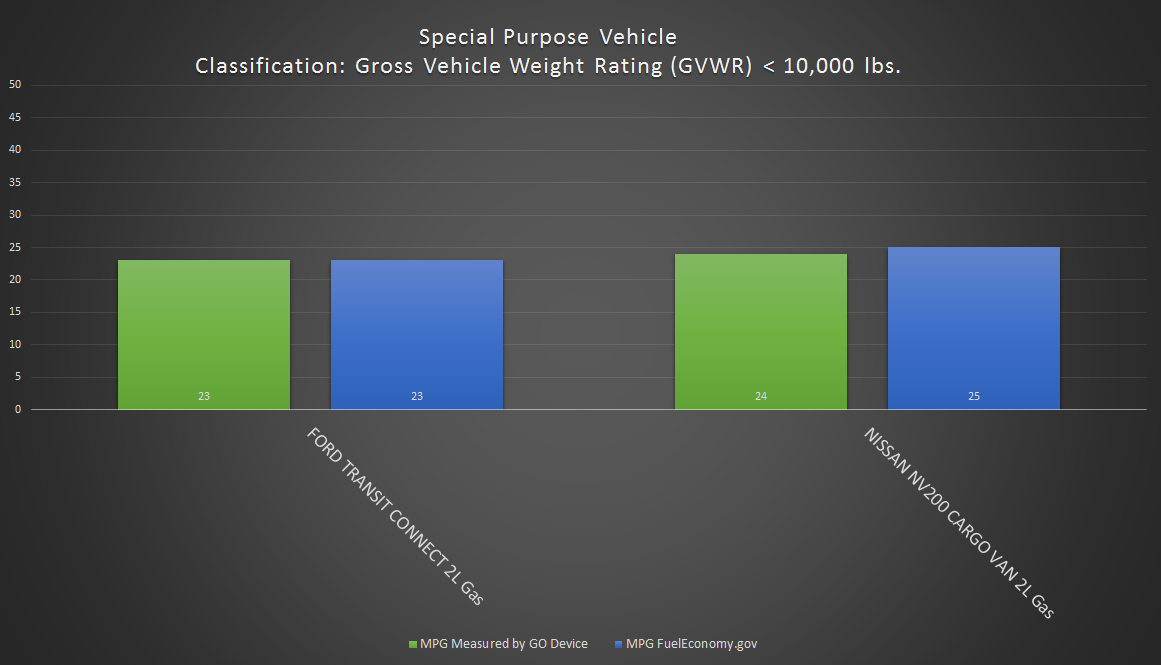
In many vehicles, the measured MPG is just slightly lower than the expected EPA value. It is not uncommon to see a slightly lower MPG in colder months [3]. It would be interesting to see the difference with these reports re-run in the summer months.
Contact Geotab if you notice a discrepancy between the EPA reported MPG and actual MPG of your vehicle measured by the GO device. The Geotab support team may require you to complete the procedure described on the fueleconomy.Gov website.
References:
- Top Ten Misconceptions About Fuel Economy, #10 All vehicles are tested for fuel economy at http://www.fueleconomy.gov/feg/topten.jsp
- http://www.fueleconomy.gov/feg/how_tested.shtml
- http://www.fueleconomy.gov/feg/coldweather.shtml
Related:
How to Enroll in the Geotab Beta Program for Firmware
8 New Custom Fleet Management Reports – Download Now
Subscribe to get industry tips and insights
The Geotab Team write about company news.
Table of Contents
Subscribe to get industry tips and insights
Related posts

Construction fleet management software: What mixed fleets should look for
July 29, 2026
5 minute read

From video archives to active prevention: The case for AI dash cams
July 22, 2026
4 minute read


Maintenance log template: How fleets track repairs, stay compliant and cut costs
June 3, 2026
5 minute read