Can you predict wait times at major city intersections?
Have you ever been running late to work, only to get stuck at every intersection? What if you were able to predict your wait time before setting off?

By Renjie Mao
Aug 21, 2024
Geotab recently teamed up with Kaggle and BigQuery to host the BigQuery-Geotab Intersection Congestion competition using Geotab datasets to identify how to improve safety, optimize operations and identify infrastructure challenges.
Geotab Kaggle Project overview
Geotab provided data consisting of aggregated trip logging metrics from commercial vehicle telematics devices. The data was grouped by the intersection, month, hour of day, direction driven through the intersection and whether the day was on a weekend or not.
Each participant was required to make predictions and summarize the distribution of wait times and stop distances at each intersection.
The findings
The following is a summary of what was discovered about the four cities of Atlanta, Boston, Chicago and Philadelphia. Data was analyzed from over 4,500 intersections, including approximately 2,000 in Chicago, 1,250 in Philadelphia, 1,000 in Boston and around 400 in Atlanta.
Definitions:
- Total time stopped is the amount of time spent at zero speed.
- Time from first stop is the time from the first stop until the vehicle passes through the intersection.
- Distance to first stop is the distance from the center of the intersection to the first stop, to give an idea of queue length.
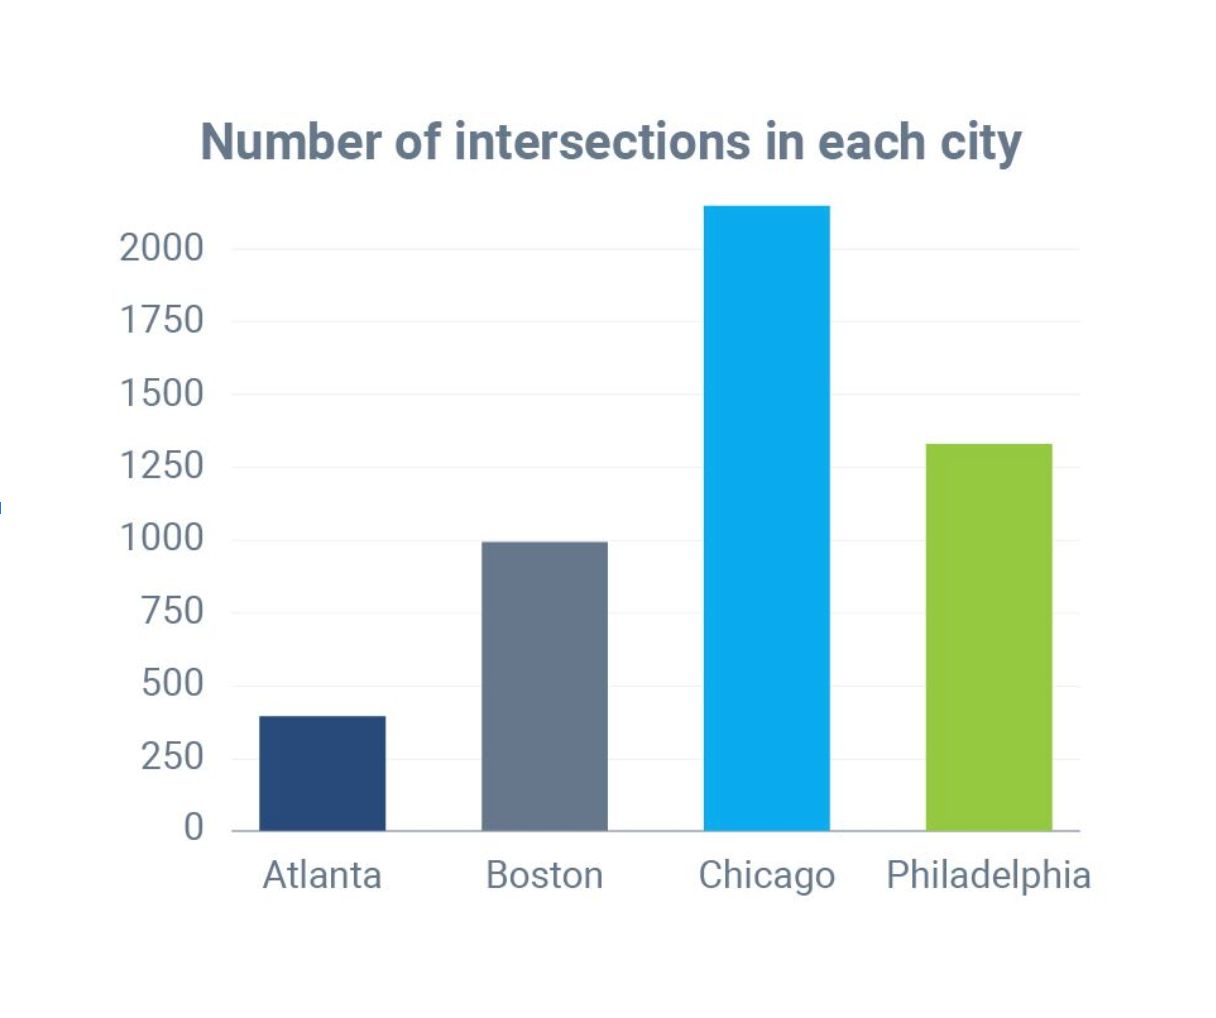
The number of intersections measured in each city.
Cities with longest stop times
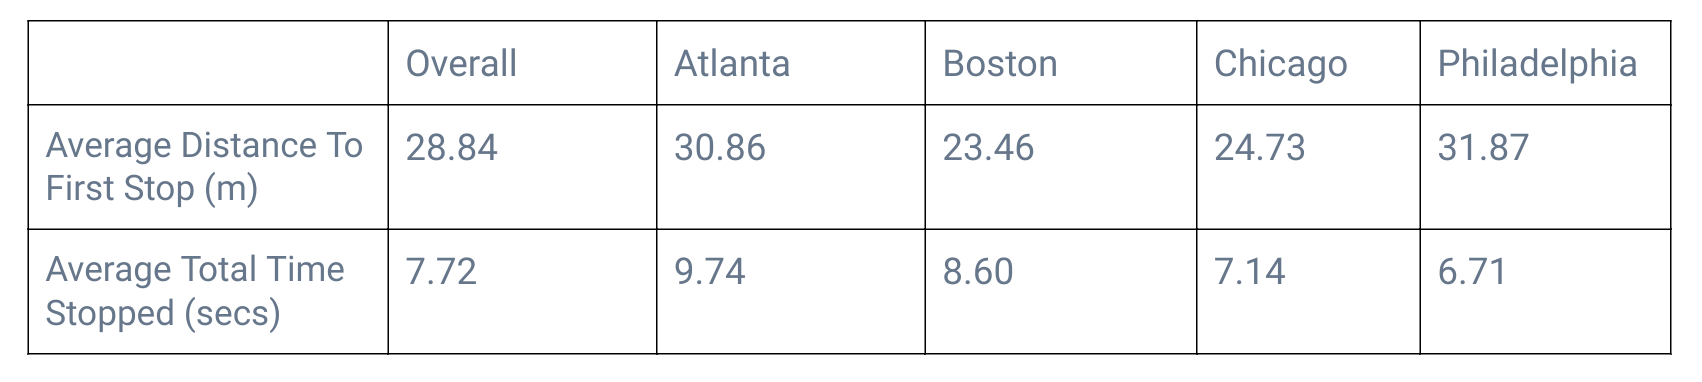
Atlanta had the longest total time stopped, with vehicles waiting 9.74 seconds on average at intersections, as shown in the chart below. That was followed by Boston, with an average total time stopped of 8.60 seconds. Philadelphia had the shortest stop time.
Longest queues at intersections
Philadelphia had the longest average distance to first stop at 31.87 meters. Atlanta had the next longest distance with 30.86 meters. Chicago and Boston had lower average distance to first stop at 24.73 and 23.46 respectively.
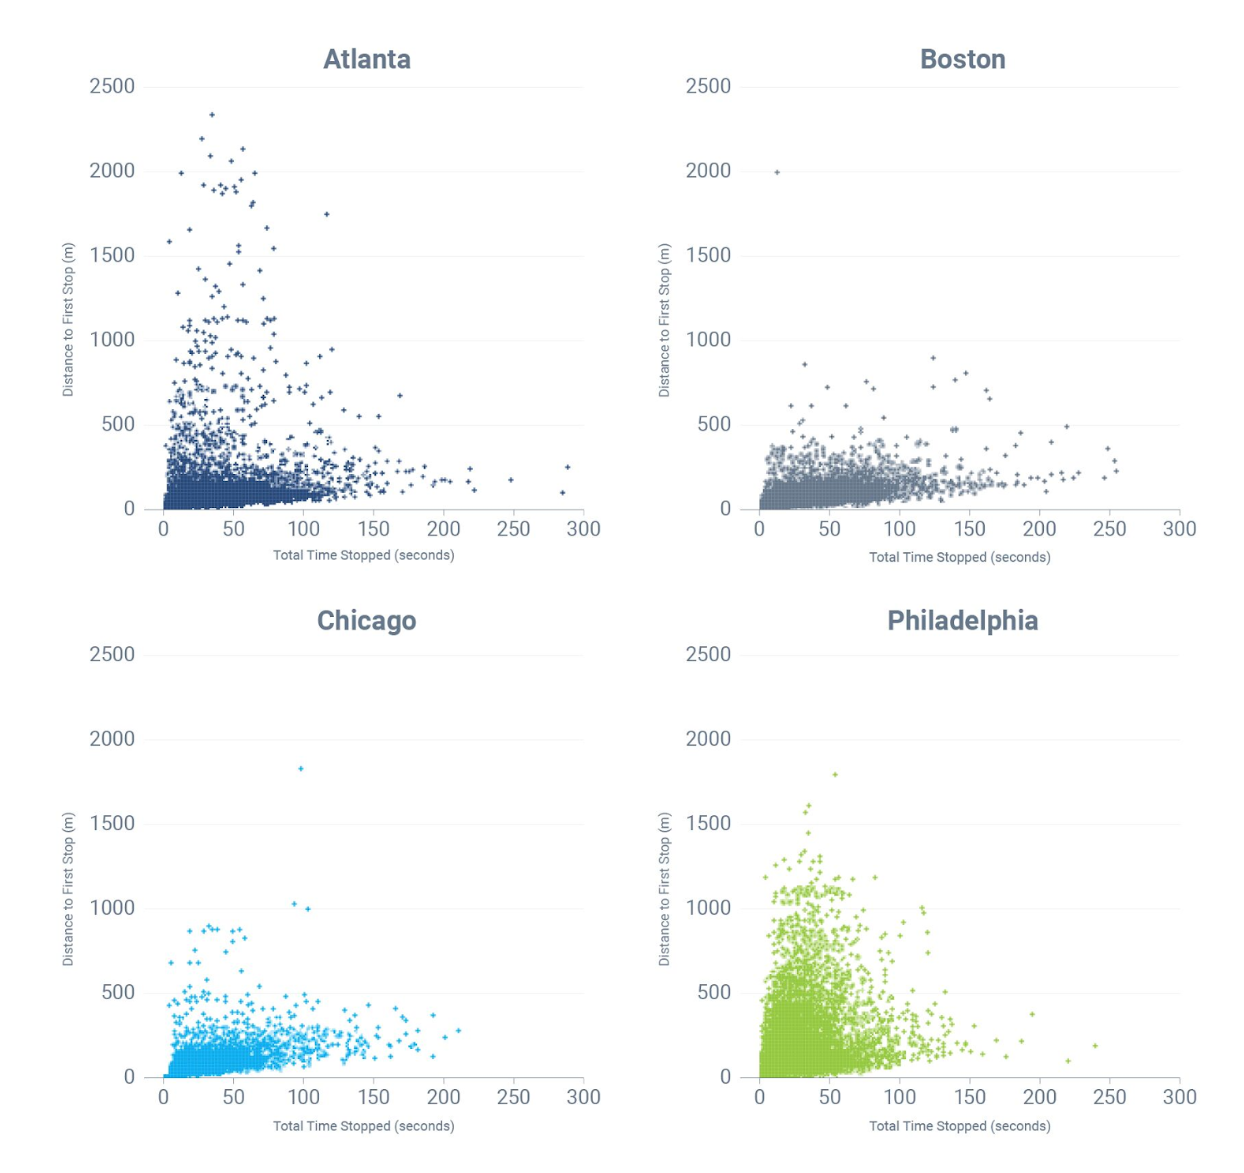
Total time stopped and distance to first stop correlation (weekdays)
- Since Atlanta has fewer intersections, the data shows a wider distance to the first stop which causes long lines.
- Philadelphia shows a short total time stopped but with a long distance to the first stop. As the city has the most traffic on the road, this could explain the longer lines at intersections.
- Chicago has the shortest lines at the intersection (the data is more concentrated), due to the fact that Chicago has the most intersections and least traffic.
Total time stopped vs the distance to first stop correlation on weekdays:
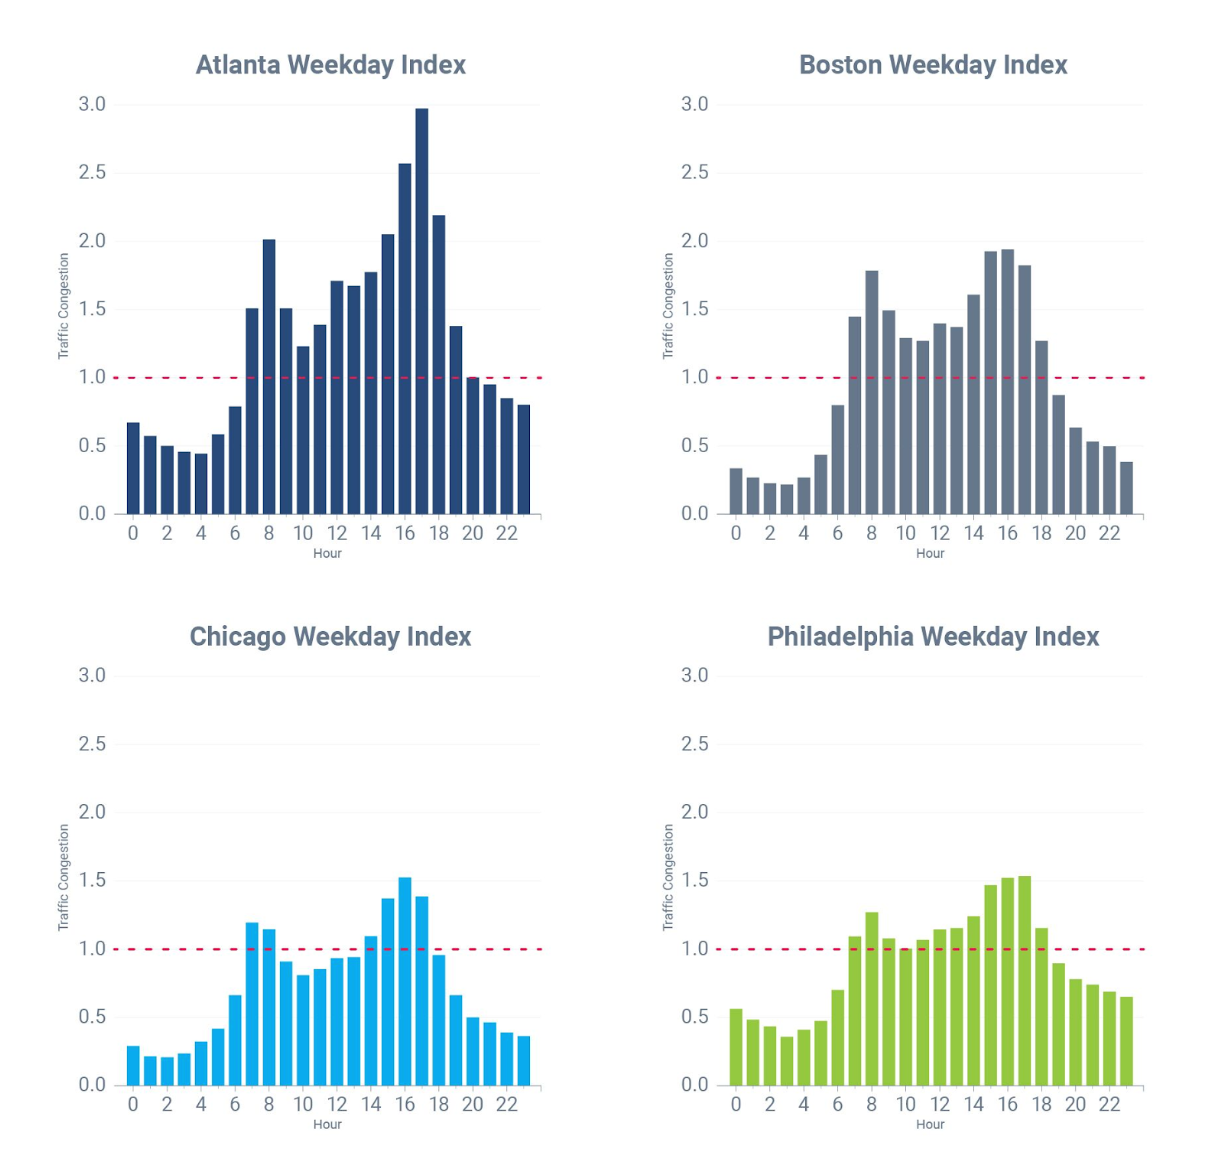
What does the traffic look like by hour during the weekday?
Atlanta deals with traffic jams for most of the day (7 a.m. - 7 p.m.), while Chicago only shows two peaks including one in the morning and one in the evening. This could be partly explained due to the fact that Atlanta has the least amount of intersections while Chicago has the most. Based on these datasets, an increase in the amount of intersections can reduce traffic issues in a city.
Stopped time hourly trend on weekdays:
For each city, what are the top 5 intersections during morning peak and evening peak on a weekday?
From the analysis, here are the most congested intersections from each city, morning and evening peak:
Atlanta
- Krog Street NE and Edgewood Avenue NE (morning peak)
- North Avenue NW and Centennial Olympic Park Drive NW (evening peak)
- In Atlanta, the evening rush time traffic is 1.7 times congested compared to the morning rush.
Boston
- Evening rush time traffic will be 1.2 times more congested in comparison to the morning rush time.
Chicago
- Evening rush time traffic will be 1.3 times more congested compared to morning rush time.
Philadelphia
- Evening rush time traffic will be 1.4 times more congested in comparison to morning rush time.
Top 5 congested intersections on weekday in seconds:
.jpg)
.jpg)
.jpg)
.jpg)
Conclusion
Clearly, data can be extremely powerful in terms of improving safety and operations. To learn more about connected vehicle insights for fleets and smart cities, visit data.geotab.com.
Subscribe to get industry tips and insights
Renjie Mao is a Data Analyst at Geotab.
Table of Contents
Subscribe to get industry tips and insights
Related posts
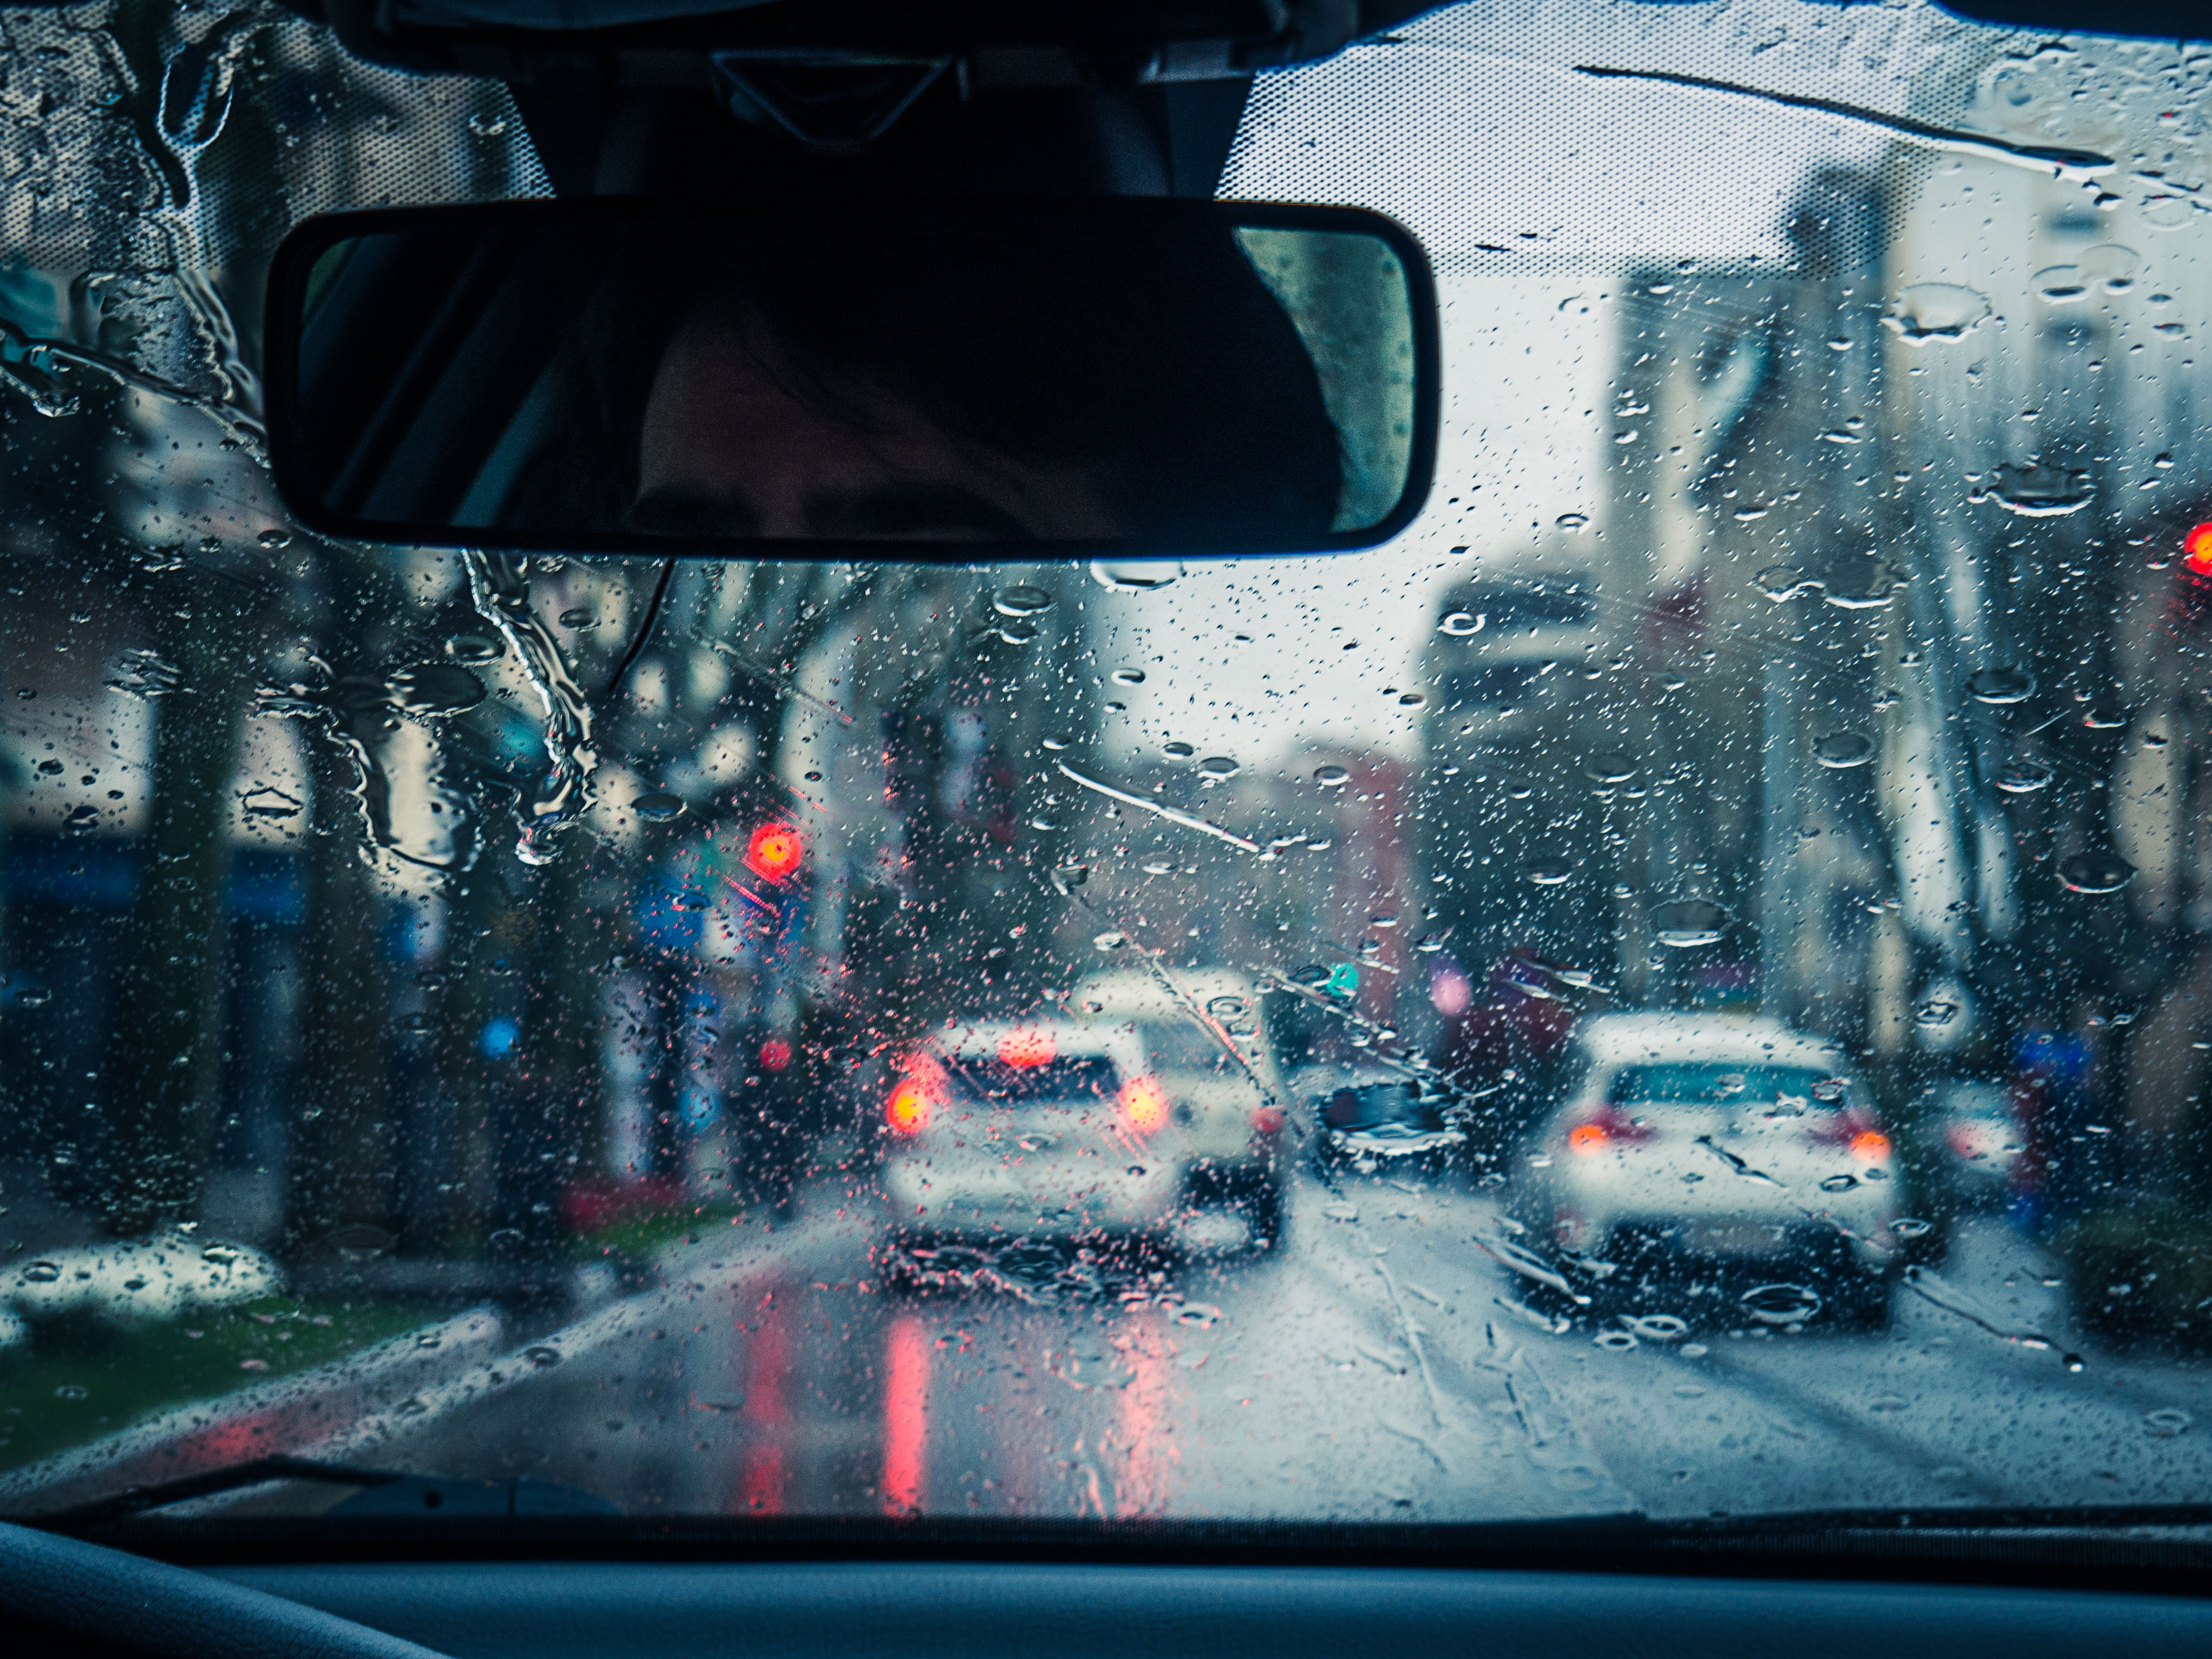
Driving Through the Deluge: How Rain Affects Traffic Speeds Across Major Cities
March 5, 2026
1 minute read
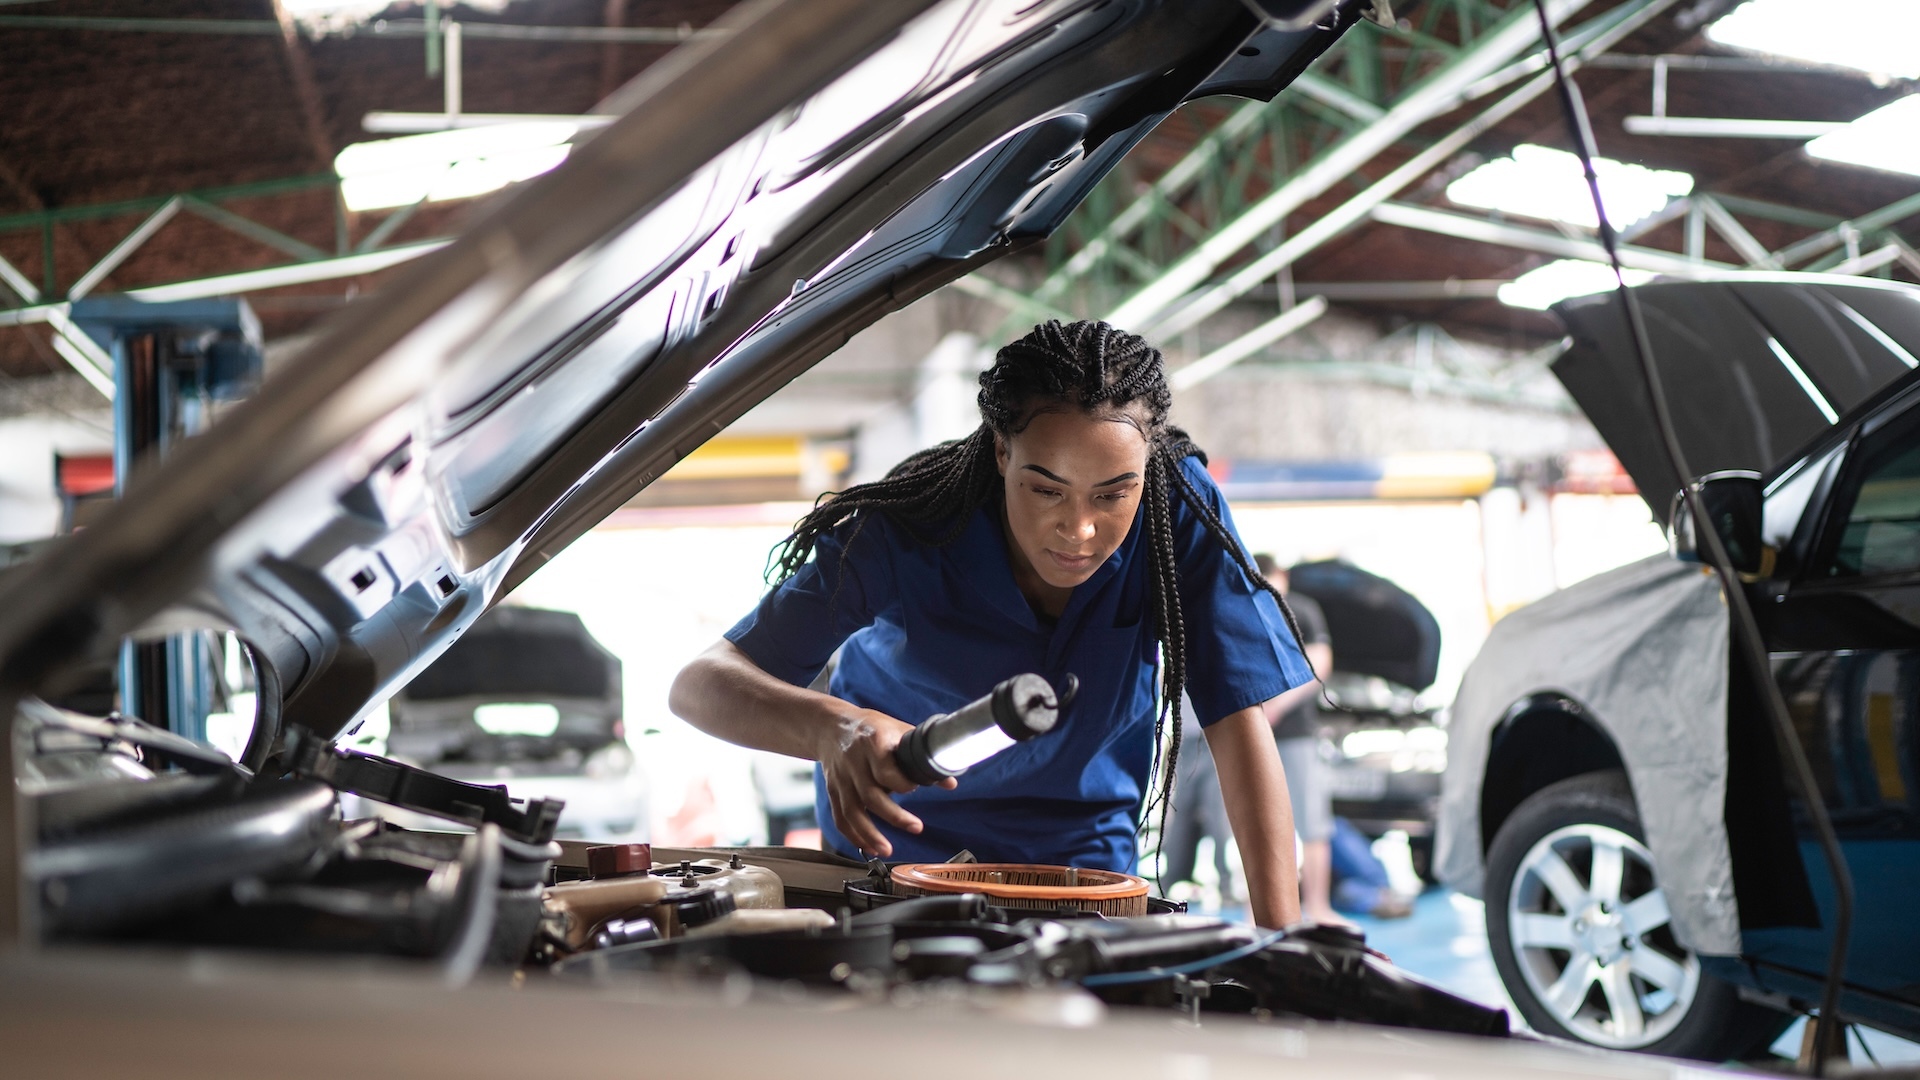
How to stop wasting mechanic hours on ‘ghost codes’ and low-priority repairs
February 2, 2026
2 minute read


How long do electric car batteries last? The updated guide to real-world EV battery health
January 12, 2026
10 minute read