Gardiner Traffic Slowdowns Are Impacting Business Productivity, Geotab ITS Analysis Reveals
Published on June 6, 2024
Travel times have increased 250% in the morning rush hour period.
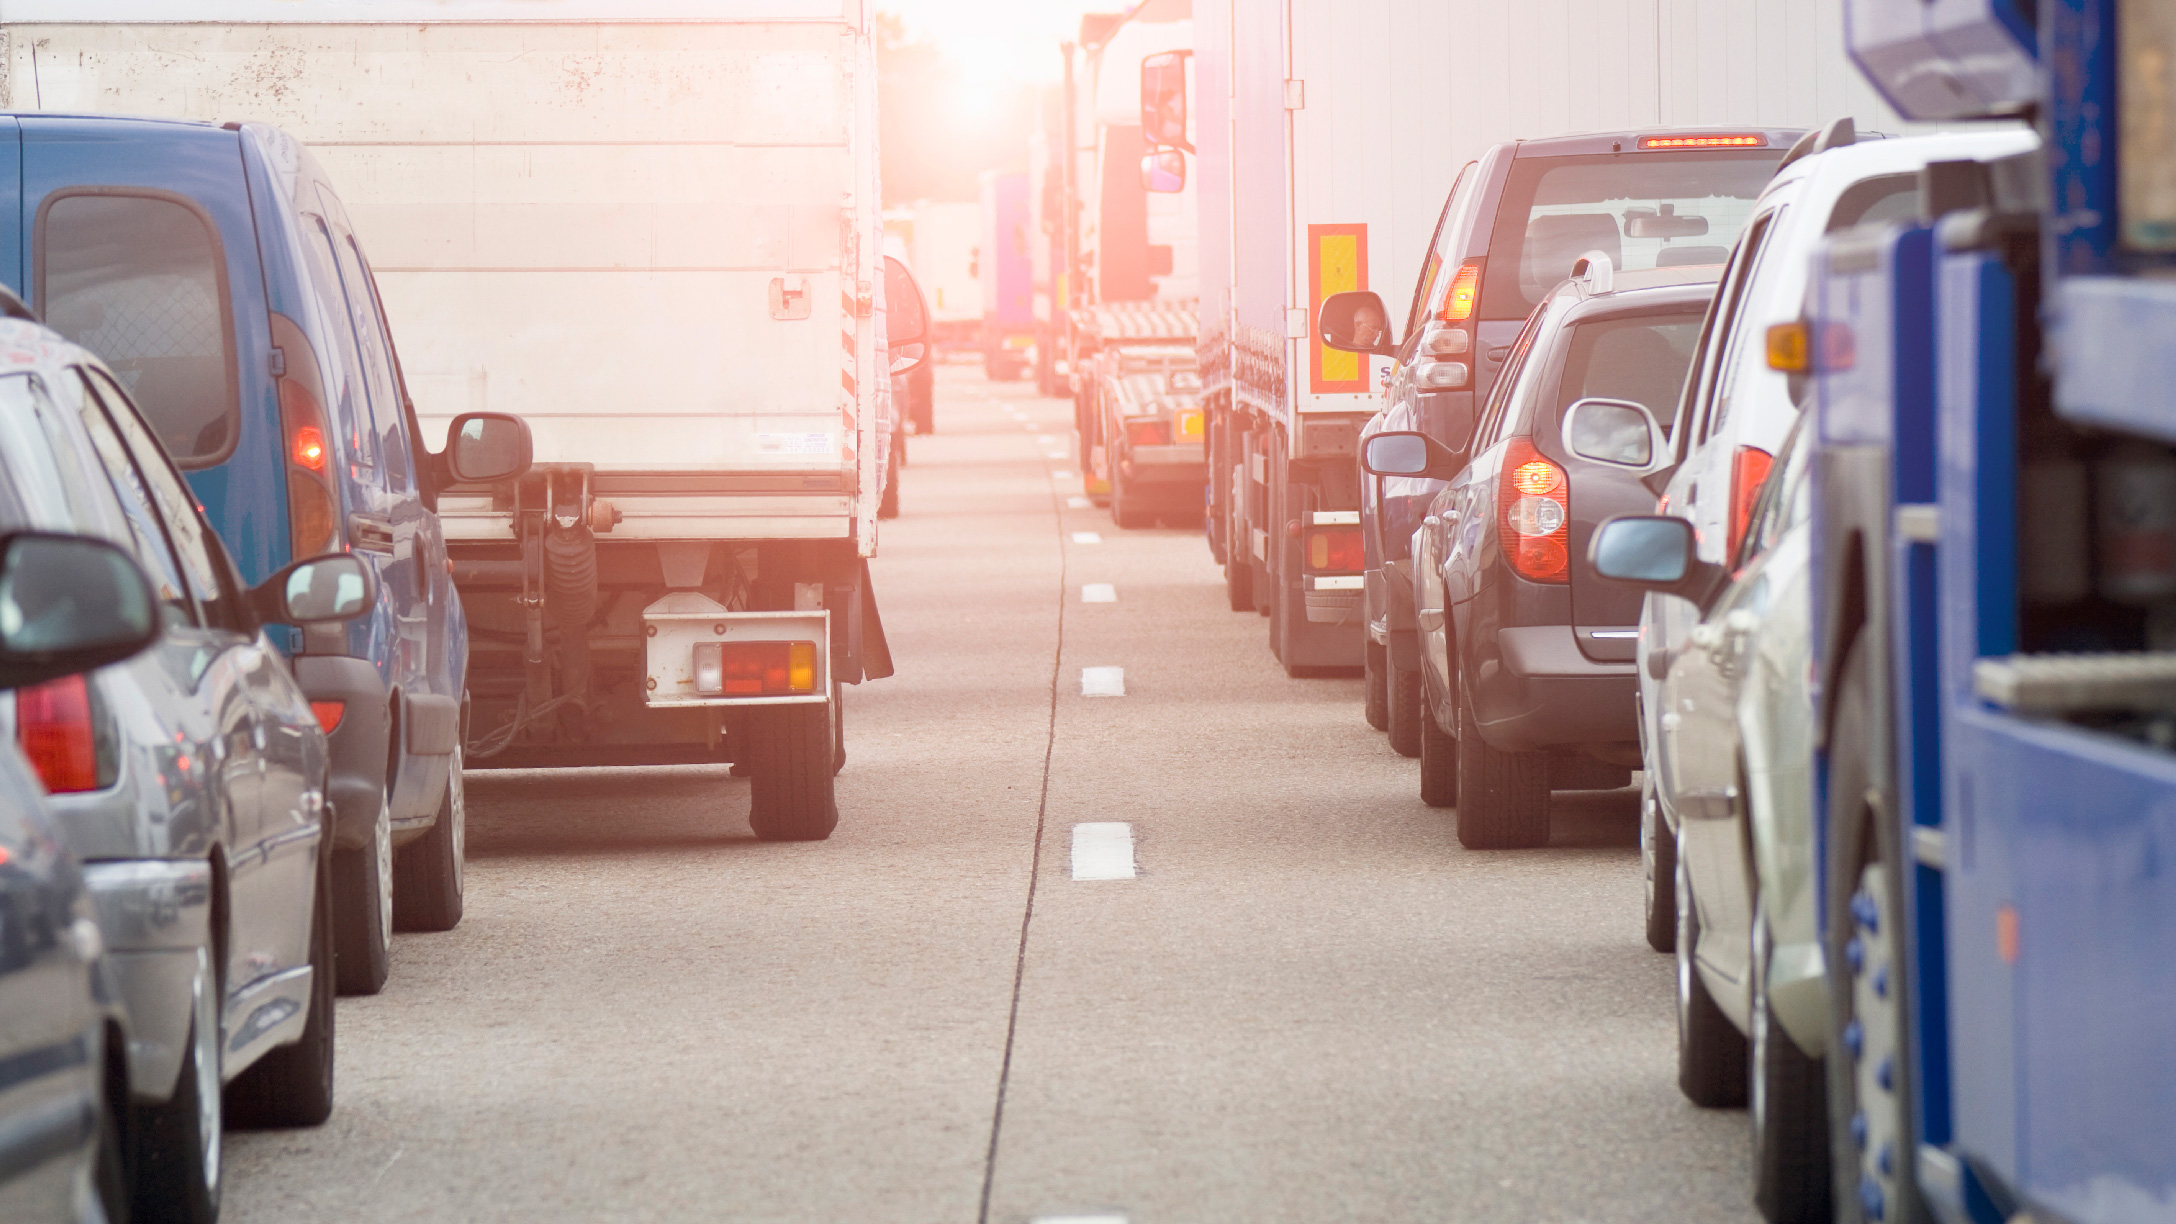
Toronto, Ontario (June 6, 2024) - The latest construction project on the Gardiner Expressway — a major transportation route which is traveled by approximately 140,000 vehicles each day — has already made an impact on driving time and emissions. A Geotab ITS study on commercial vehicle traffic on the Gardiner reveals that recent slowdowns due to construction are having an impact on business productivity in Toronto:
- Travel times on the Gardiner have increased up to 250% in the morning rush hour and 230% in the afternoon rush hour.
- Commercial drivers are spending 80% more time driving per day on the Gardiner.
- Emissions have increased 23% due to the extra driving time (an additional 1,200 kg of CO2 per day).
- The amount of traffic traveling less than 25 km/hr has doubled.
- The top three alternate roads have seen an average traffic increase of 43%.
Significant increase in travel time during commuting hours
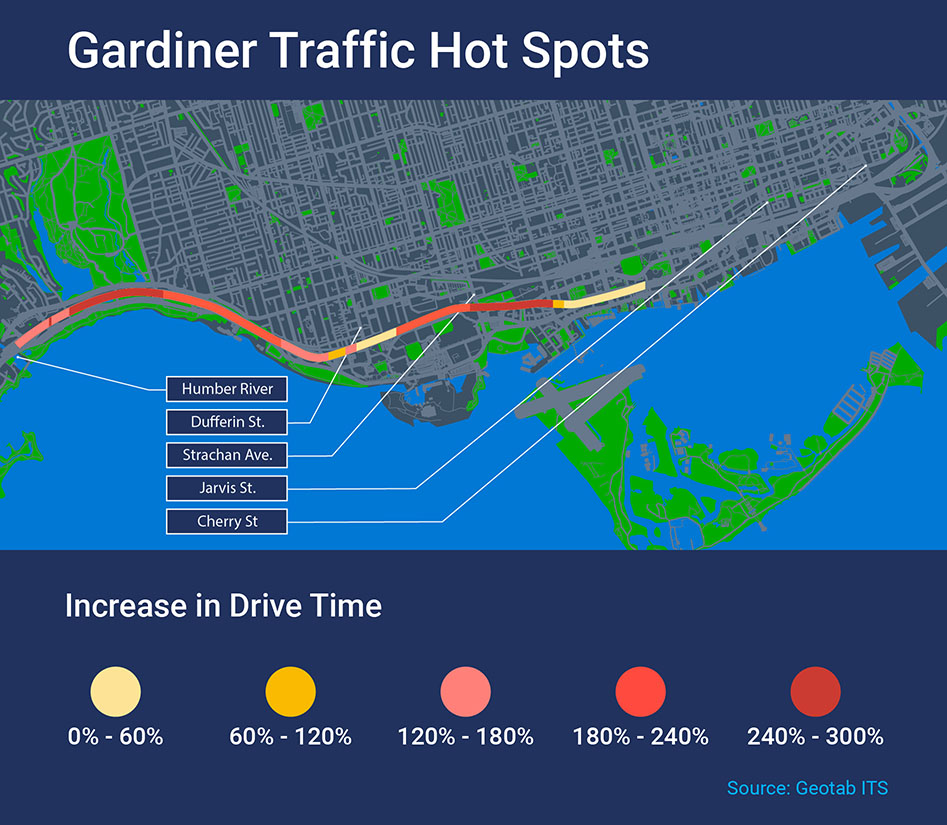
Since construction began on March 25, 2024, commercial vehicle drivers are spending more time on the road. Travel time in some areas of the Gardiner has doubled. Geotab ITS found that the average time to travel from the Humber River to Strachan Ave. increased from 8 minutes to 20 minutes, and the typical time to travel the 5 km stretch between Jarvis St. and Dufferin St. is now 25 minutes instead of 11 minutes.
During the morning rush hour, from 7-10 am, travel times on the Gardiner increased by up to 250% on the westbound lanes, as compared to pre-construction traffic. Travel times also increased by up to 230% on the Gardiner eastbound during the afternoon rush hour. Average drive times were most impacted around 8 am, as well as the 3 pm and 4 pm commuting hours.
Slowdown adds pressure to last mile delivery
On the Gardiner, commercial vehicle drivers are spending 80% more time driving per day on average compared to the pre-construction period. The rise in travel time is impacting business productivity. The increased drive time adds pressure particularly to last mile delivery companies, which are already facing demand challenges due to the growth in e-commerce.
The Toronto Region Board of Trade reports that traffic congestion costs over $11 billion in productivity losses each year, and impacts trade and productivity in the city. In 2023, there were 19 million annual commercial trips in the Toronto downtown core, representing 151 million kilometers driven.
Geotab’s recent State of Commercial Transportation examined overall productivity and looked at both the average number of trips per day, average driving duration per day and trip to hours ratio as proxies for gained (or lost) productivity by fleets. In this context, we see that commercial fleets have experienced decreased productivity due to the Gardiner closure. For commercial fleets, in addition to the potential impact to service, spending more time in traffic can add up in fuel costs. For every hour of idling, an engine wastes 3 litres of fuel.
Vehicle emissions increased
Longer drive times on the Gardiner are increasing CO2 emissions from commercial vehicles. Increased driving time led to a 23% increase in emissions, equating to approximately an extra 1,200 kg of CO2 daily from the vehicles in the study — the same as the carbon footprint of a premium roundtrip flight from Toronto to Vancouver. As well, Geotab ITS identified a 26% increase in commercial vehicle idling time.
Traffic-related air pollution (TRAP) from cars, trucks and other vehicles is the largest source of air pollution in Toronto. Air pollution can have a negative impact on health and has been linked to respiratory and cardiovascular diseases and cancer, and increased levels of air pollution from traffic reaches up to 250 meters from a major road.
Traffic shifts to secondary roads
Other Toronto roadways have seen increased commercial traffic as drivers seek alternative routes. The top three roads most impacted by commercial traffic congestion, with an average increase of 43%, are:
- Harbour St. (72% increase in travel time)
- Lakeshore Blvd. (30% increase in travel time)
- Cherry St. (27% increase in travel time)
About the traffic study
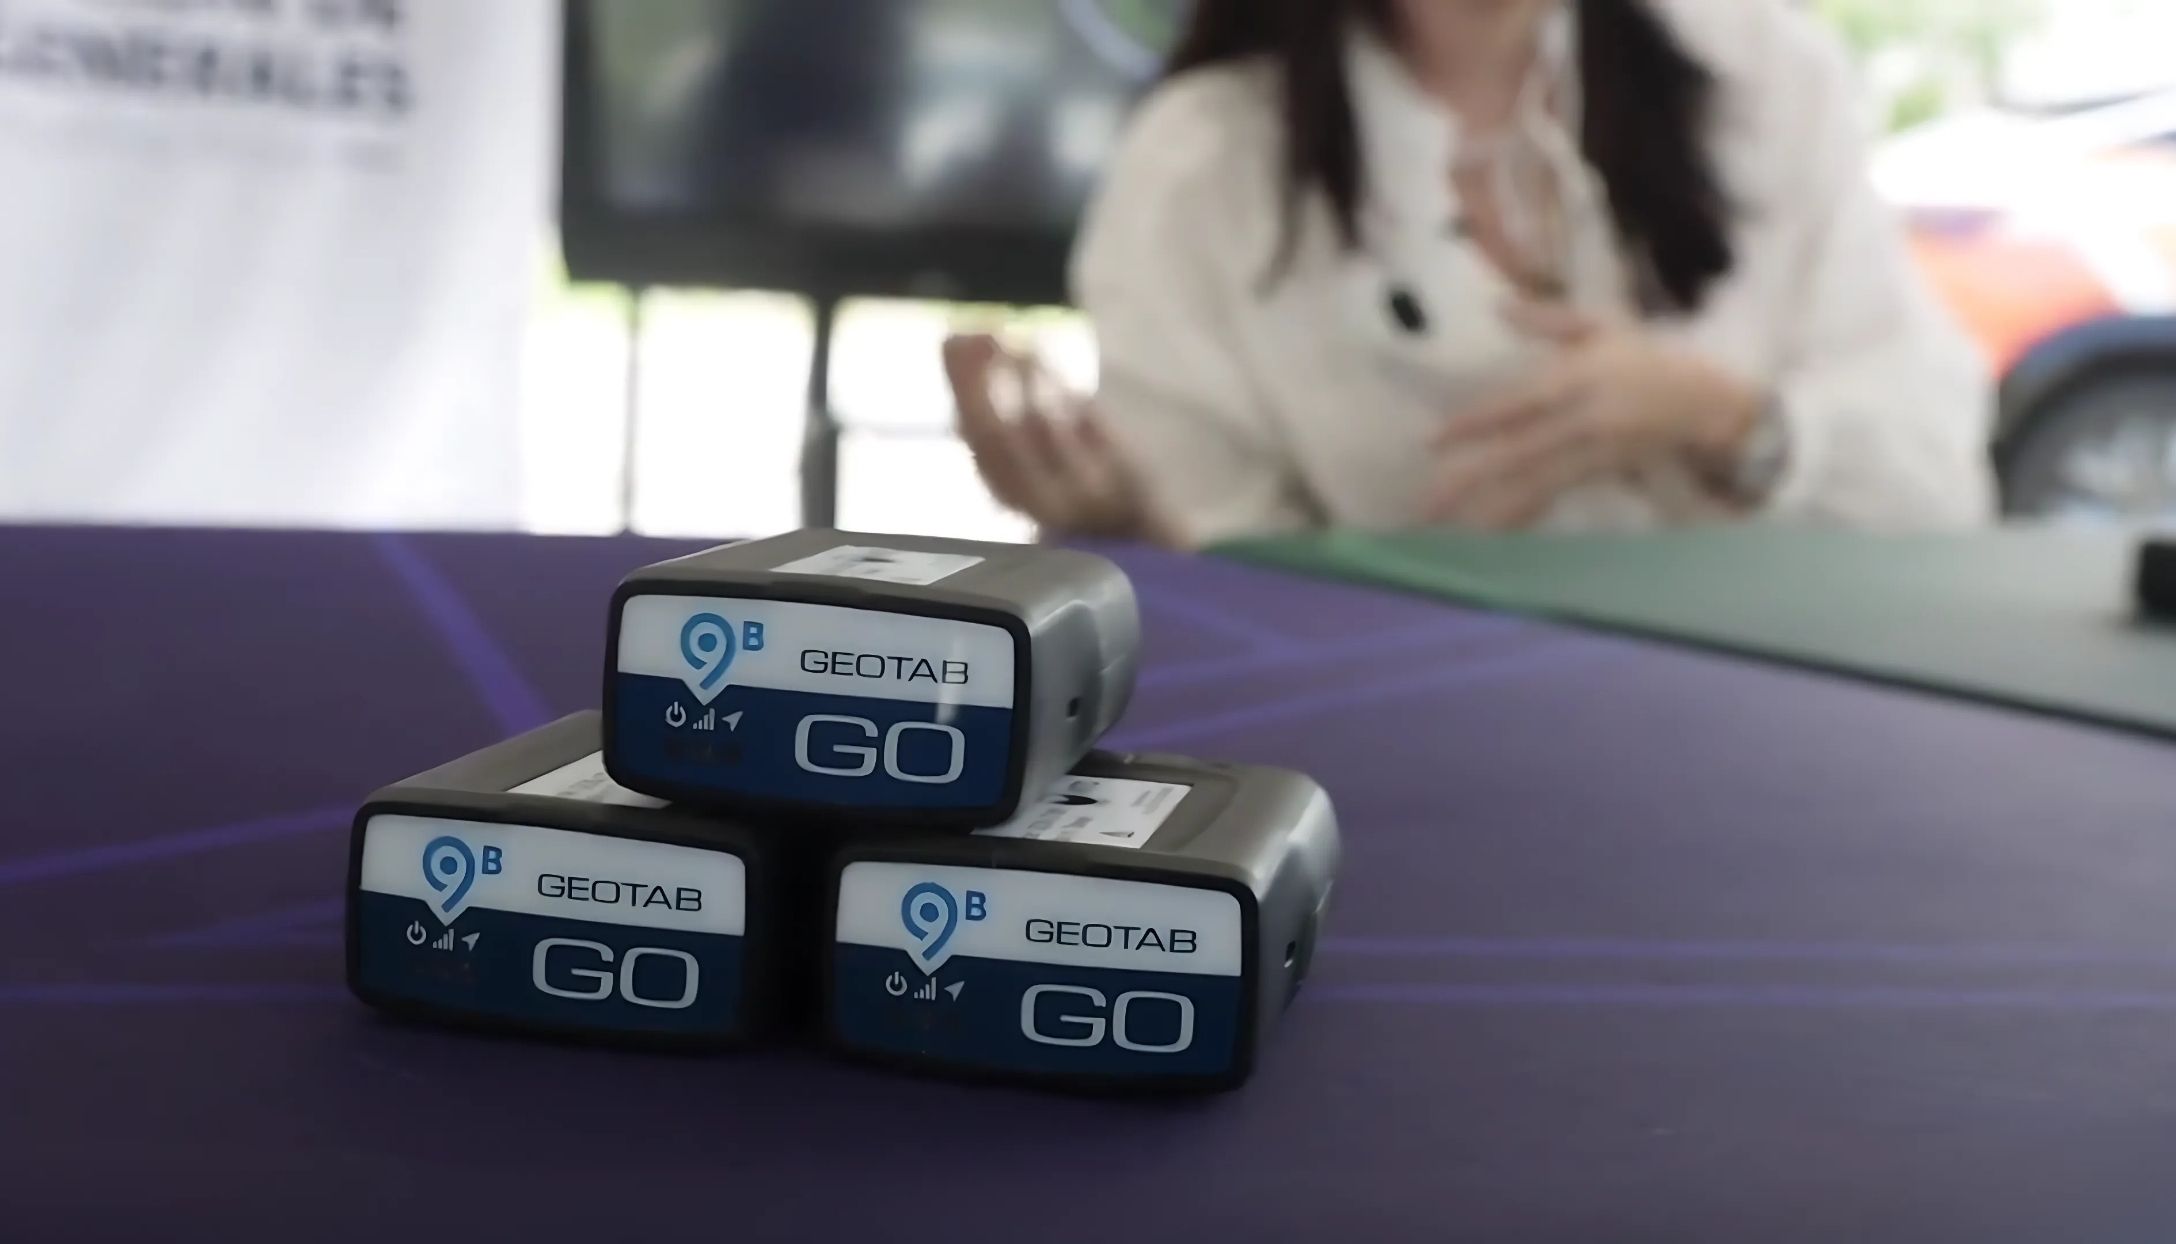
Data insights were derived from Altitude, the aggregate transportation analytics platform from Geotab ITS, which provides contextualized insights on fleet and freight vehicle movement in an aggregate micro and macro picture. The analysis was based on over 10,000 commercial vehicles.
The Altitude platform provides crucial insights based on real-world trips to support safer, more efficient and more livable cities. Context-added transportation data is valuable because it provides deeper insight into overall regional vehicle movement, ultimately helping planners better understand vehicles’ diverse purposes and travel tendencies.
For more information on Geotab ITS, visit: https://its.geotab.com/altitude/
About Geotab Intelligent Transportation Systems (ITS)
Our team of data science, AI, software engineering and user experience specialists has one purpose – helping transportation data stakeholders understand and act on the context behind their traffic data.
We aggregate observed, real-world data so you can make more informed decisions to improve efficiency, sustainability, profitability, and safety. For more information on Geotab Intelligent Transportation Systems and the Altitude Platform, visit: its.geotab.com and follow us on LinkedIn.
Media Contact
Nicole Riddle
Senior Specialist, Strategic Communications
pr@geotab.com
About Geotab
Geotab is a global leader in connected vehicle and asset solutions, empowering fleet efficiency and management. We leverage advanced data analytics and AI to transform fleet performance, safety, and sustainability, reducing cost and driving efficiency. Backed by top data scientists and engineers, we serve over 55,000 global customers, processing 80 billion data points daily from more than 4.7 million vehicle subscriptions. Geotab is trusted by Fortune 500 organizations, mid-sized fleets, and the largest public sector fleets in the world, including the US Federal Government. Committed to data security and privacy, we hold FIPS 140-3 and FedRAMP authorizations. Our open platform, ecosystem of outstanding partners, and Marketplace deliver hundreds of fleet-ready third-party solutions. This year, we're celebrating 25 years of innovation. Learn more at www.geotab.com and follow us on LinkedIn or visit Geotab News and Views.
Related posts
Puerto Rico Government Selects Geotab for Telematics Solutions
April 17, 2025

Not an April Fools’... telematics firm Geotab helping British scientists take a comfier poo in the Antarctic
April 1, 2025
Recent News
Puerto Rico Government Selects Geotab for Telematics Solutions
April 17, 2025


Geotab Wins a Google Cloud Partner of the Year Award
April 8, 2025