Using telematics insights to reduce your fleet’s scope 2 emissions
As fleets transition to electric vehicles, quantifying and controlling scope 2 emissions becomes evermore important. Learn how the right telematics solution can provide you with the insights to do so.

Scope 2 GHG emissions
The GHG Protocol Corporate Standard defines scope 2 carbon emissions as those related to the electricity, steam, heating and cooling that your organisation purchases. This includes the electricity used to power any electric vehicles (EVs), whether they are charged on the company premises, or off-site.
As fleets transition to EVs, scope 2 emissions therefore become more important for managers to quantify and control. In this article, we look at how connected vehicle insights provided by the right fleet telematics provider can help.
The relevance of EVs for scope 2 reporting
From a scope 1 perspective, EVs are carbon-neutral to operate. This is because they emit no greenhouse gases (GHG) while operating, unlike conventional vehicles which burn fossil fuels.
However, while they take energy from the National Grid, GHGs are still emitted by the gas power stations used to power them. In the UK, the Grid is projected to be using 100% renewable sources by 2035, at which point your EV operations will also be carbon neutral from a scope 2 perspective (there will still be scope 3 emissions related to the manufacturing and end of life treatment of the vehicles).
If your organisation reports on its scope 2 emissions, then the emissions associated with EV energy usage will need to be incorporated into its carbon footprint, and strategies developed to reduce them. The UK Government’s data for 2022 states that the average energy mix from the National Grid emits 0.21302 CO2 equivalent per kWh of consumed electricity (allowing for grid losses).
The benefits of reporting on scope 2 emissions
There are three main drivers for organisations and fleets to report on their scope 2 emissions:
- To work towards a complete understanding of the entire carbon footprint for greater control
- To identify internal GHG reduction opportunities, and track performance at improving EV driving efficiency
- To enhance the organisation's corporate reputation by reporting more transparently
How Geotab helps you improve EV energy efficiency
Geotab’s connected vehicle insights support you in your efforts to improve the energy efficiency of your EVs, and in doing so, to reduce energy consumption and associated scope 2 emissions.
Electric vehicle suitability assessment (EVSA)
With Geotab’s EVSA, you can have the confidence that the EVs you select to replace existing conventional vehicles will be the right fit for the job. This increases the ability of each new EV to be able to achieve optimal EV energy efficiency – in other words, for it to be as efficient as possible to operate – before you take factors such as driving behaviour into account.
Full EV support
When operating EVs, you need access to rich vehicle data to ensure their ranges are being optimised, vehicles are being charged properly, and are being driven at their maximum efficiency. For this to happen, your telematics provider needs to fully support the EVs in your fleet. This means that the system can extract all the necessary data from the vehicle, which isn’t as easy as you would imagine. Unlike conventional vehicles, EVs do not follow mandatory telematics data standards, making data access a challenge. Geotab is the market leader for EV support, officially supporting 200 makes and models of EVs and counting, from cars and buses, to LGVs and HGVs.
EV energy usage report
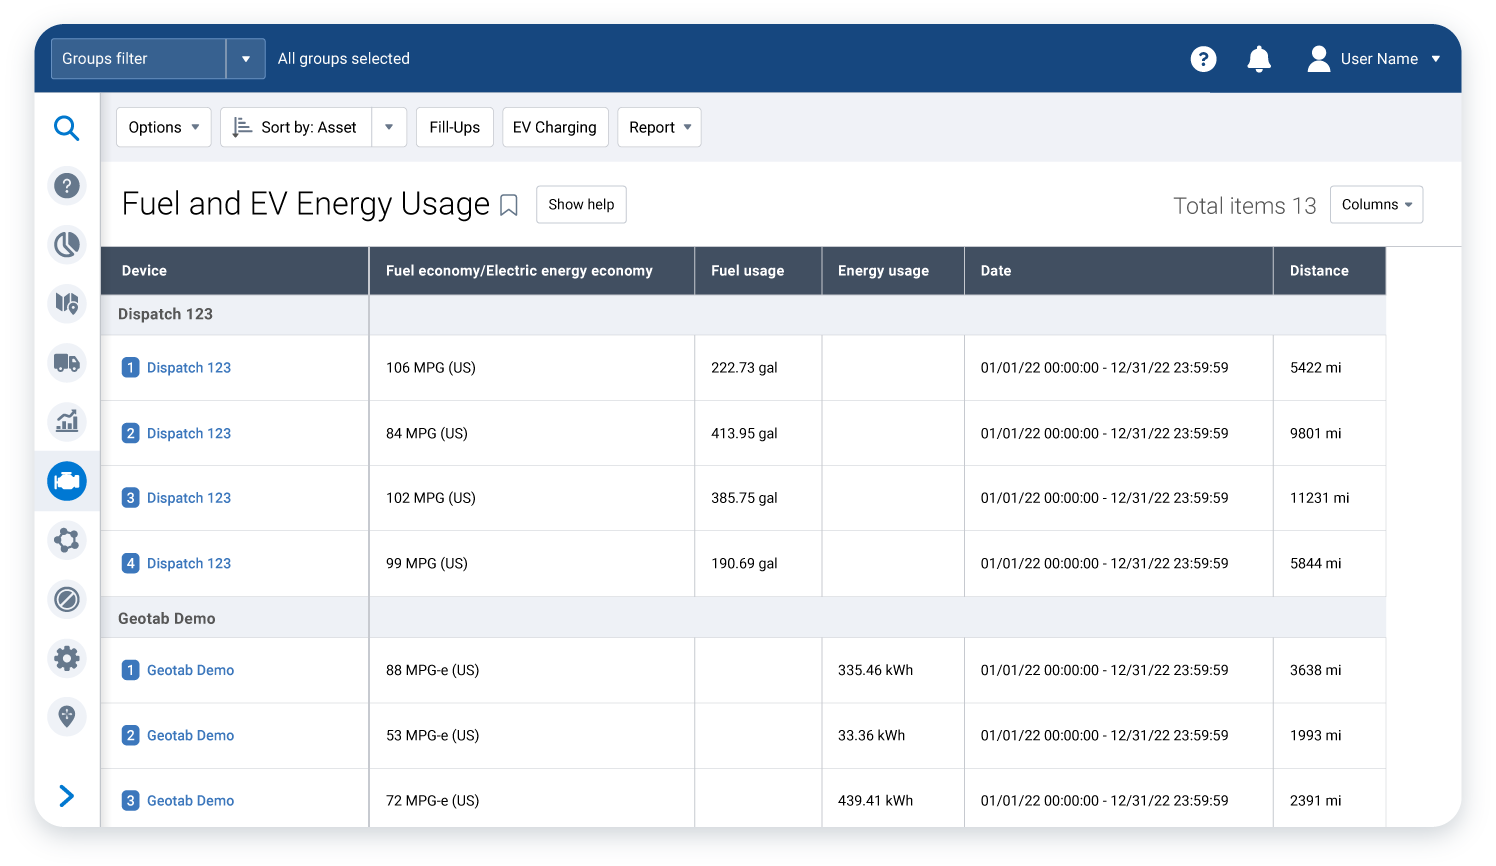
In MyGeotab, you can review EV energy usage and track the performance of EVs against any conventional vehicles in your fleet, with electric energy economy available as miles per gallon equivalent (mpg-e), or miles per kWh (mi/kWh). The report also provides insight into battery usage to help ensure that it’s being maximised for any plug-in hybrid electric vehicles (PHEVs) in your fleet.
EV charge assurance dashboard
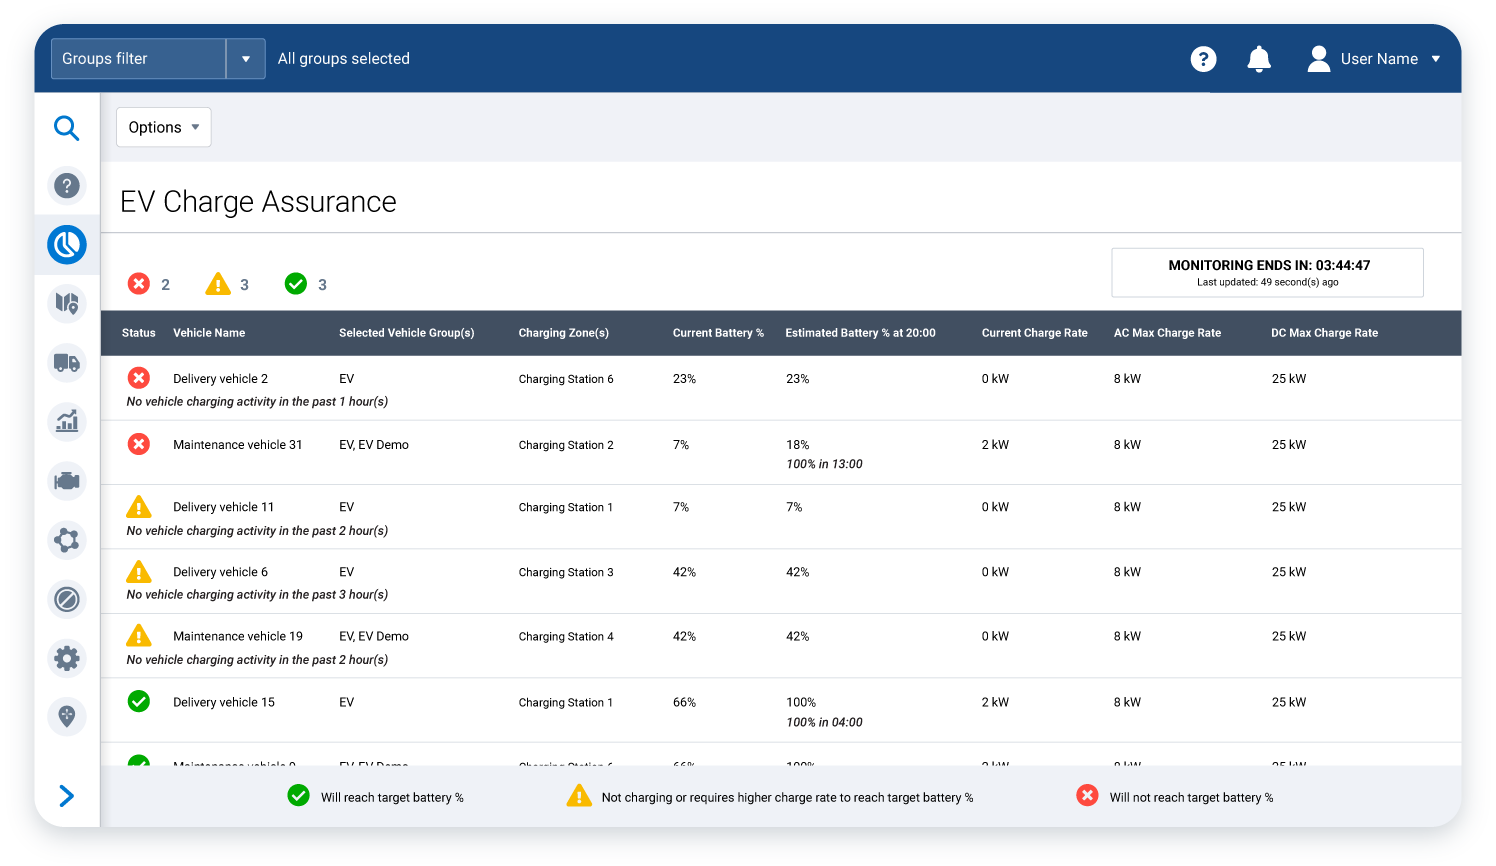
When a vehicle arrives at a charging point, whether that’s at a depot, an employee’s home, or a public charge station, you need access to data on its state and rate of charge, and the total charge received. Geotab’s charge assurance dashboard provides this insight from each vehicle and charger, with the ability to ingest data from charge points other than those in your own infrastructure.
You can use this dashboard to track key metrics including charge start to finish, charge duration, address, state of charge (SOC)% change and electric energy added. This data can increase vehicle charging efficiency by over 160%.
EV map functionality
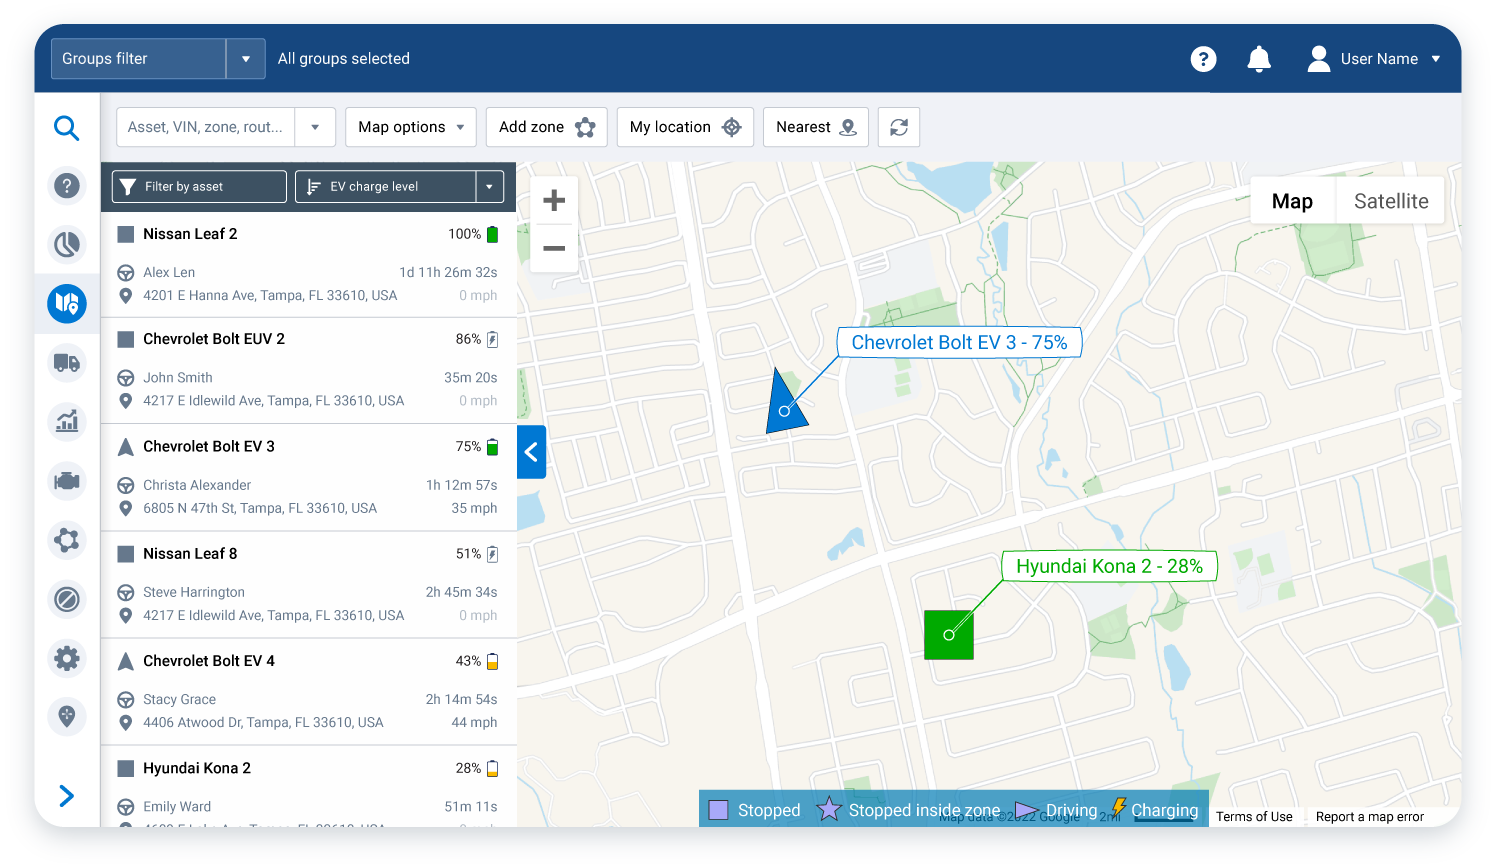
In MyGeotab, the map functionality includes real-time data on EV battery charge percentage and charging status. Insight on real-time charge status helps the dispatch team to send the closest EV to any new job that arises, in order to minimise miles travelled and maximise EV energy efficiency.
Green fleet dashboard
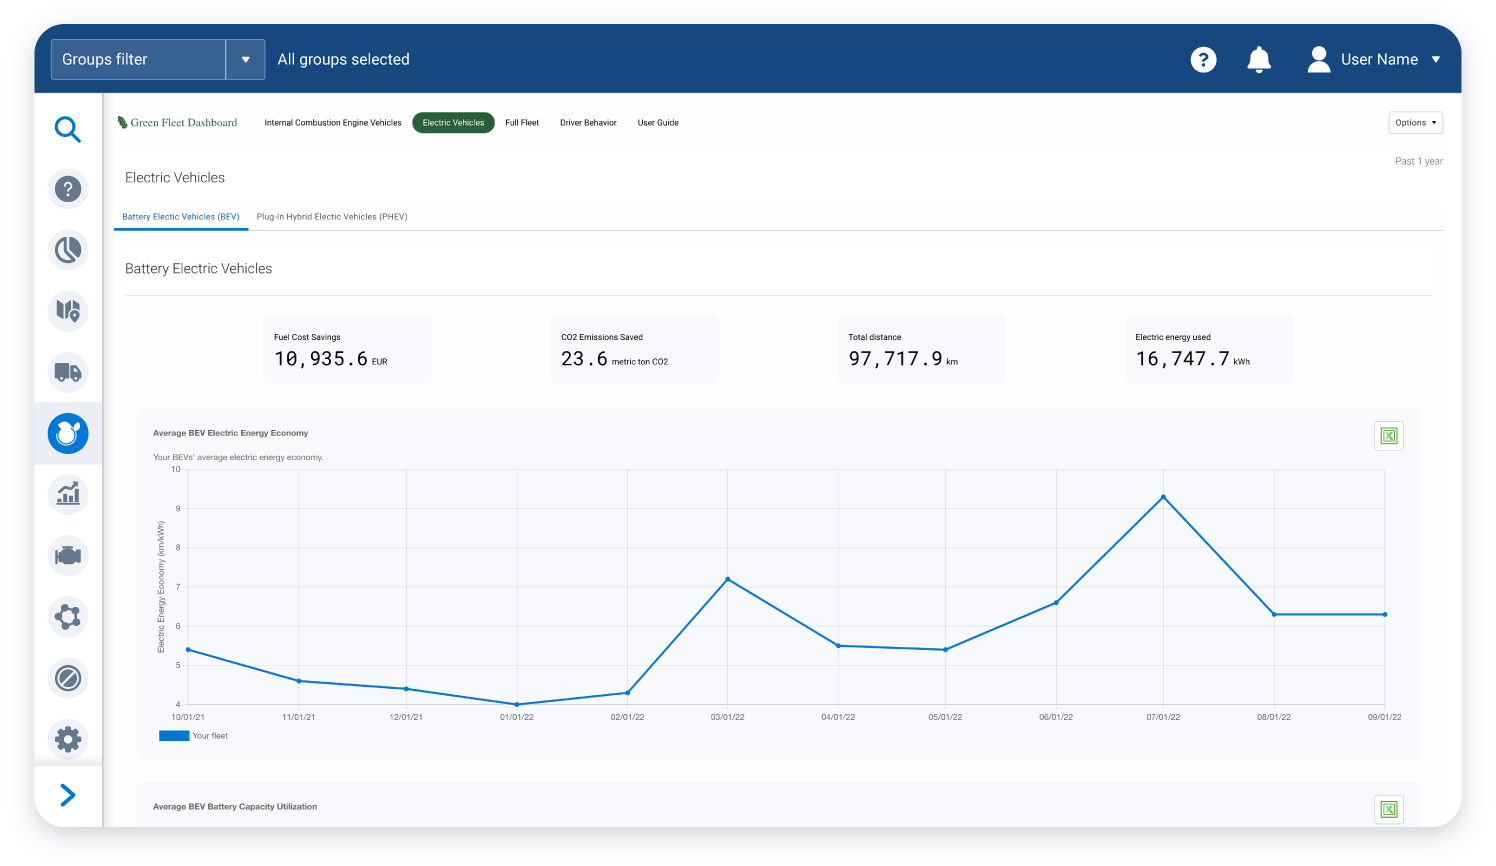
With Geotab’s green fleet dashboard, you can track your BEV and PHEV performance and utilisation, and monitor your fleet's average electric energy usage, using this data to calculate resulting emissions and optimise EV operations in order to reduce them.
It also allows you to track eco-driver performance indicators, which can greatly improve the efficiency of your EV fleet. Monitoring common issues like harsh braking and cornering, as well as idling, acceleration and speeding can help you understand where improvements can be made to reduce scope 2 emissions. EV idling alone commonly accounts for up to 6% of total energy usage, with some vehicles wasting as much as 28% of their total energy on it. This behaviour can be significantly reduced with driver training once it has been identified.
Case study - Geotab’s data helps Madrid City Council optimise EV operations
All of Madrid City Council's EVs were fitted with Geotab GO devices to provide them with key management data on:
- Distance travelled
- Daily electrical energy consumed
- Daily EV range
- Average energy consumption of each vehicle
This data enabled the team to optimise the EV fleet by:
- Detecting under- or over-utilised vehicles to balance the use of EVs appropriately and make decisions to rightsize the fleet
- Understanding how climate conditions and air conditioning usage affected the average energy consumption of each vehicle
- Measuring driver safety performance in order to develop a driver safety plan to improve energy efficiency, lowering their scope 2 emissions
"You cannot manage an electric fleet without telematics technology. Geotab's real-time and remote data is key to analyse the state of each vehicle and improve efficiency and sustainability.”
– Enrique García, Technician of the Department of Climate Change, Madrid City Council.
View the case study to learn more.
Actionable insights help you control your scope 2 emissions
By transitioning to a 100% electric fleet, your scope 1 emissions will be reduced to zero. However, organisations are under increasing pressure from consumers, investors and other stakeholders to quantify and minimise their entire carbon footprint, including scope 2 emissions. This requires fleets to consider the emissions produced when they take energy from the National Grid to power their EVs.
By increasing the energy efficiency of your EVs and optimising charging events, you can actively reduce associated scope 2 emissions and contribute to further reducing your organisational carbon footprint. Geotab’s full EV support, rich data and actionable insights provide you with the oversight you need to take complete control.
Subscribe to the Geotab Blog

Associate Vice President, Sales and Business Development, UK & Ireland
Table of contents
Subscribe to the Geotab Blog
Related posts

Strategic Implementation of Telematics for Optimising Last-Mile Delivery Operations
April 1, 2025
2 minute read
.jpg)
Lead with Trust: How Geotab Helps Businesses Navigate CSRD Compliance
March 19, 2025
2 minute read

Data-Driven Innovations in Fleet Management: highlights from Geotab Mobility Connect 2024
November 28, 2024
3 minute read
2030 or 2035, the UK Needs Meaningful Action on EVs Now
September 6, 2024
2 minute read
Driving smarter: Insights from Geotab’s “Taking Charge” Report
August 8, 2024
2 minute read
-EN-Na-final-July24_Card-1x.jpg)
Gross Vehicle Weight Rating: GVWR for heavy loads and lorries
June 26, 2024
2 minute read
