How you may be affected by scope 3 fleet emissions reporting
Learn which transport emissions are classed within scope 3 of an organisational carbon footprint, and how fleet telematics can help you provide data to your customers who report on these emissions.


Scope 3 GHG emissions
Scope 3 GHG (greenhouse gas) emissions are those that an organisation is indirectly responsible for, both up and down the value chain. They commonly account for as much as 90% of an organisation’s total carbon footprint, making them incredibly important to control and reduce. However, scope 3 emissions are generally the hardest to manage as they occur outside of a company’s direct operational control.
From a fleet and corporate transport perspective, the GHG Protocol Corporate Standard defines scope 3 emissions as those produced by:
- Your suppliers’ fleets as they provide you with goods and services
- Any third-party transportation and distribution of outbound goods and services
- Any third-party transportation and distribution that occurs between company facilities
- The transportation of employees for business related activities in vehicles owned or operated by third parties, such as aircraft, trains, buses, and passenger cars.
- The transportation of employees between their homes and the workplace in vehicles owned by the employees, or operated by third parties
How scope 3 emissions are calculated
The GHG Protocol recommends that companies use one of four methods to calculate these transport-related emissions:
- Fuel-based: Determine the amount of fuel that is consumed by each transport provider and apply the appropriate emission factor for that fuel type
- Distance-based: Determine the distance, and mode of each shipment or method of transport, then apply the appropriate distance emission factor for the vehicle used
- Spend-based: Determine the amount of money spent on each mode of business travel transport and apply secondary emission factors
- Average data method: For employee commuting, estimate emissions based on average data on commuting patterns
How smaller businesses can be affected by scope 3 emissions data requests
Even if your organisation doesn't report on its own carbon footprint, you may be requested to provide data on the fuel consumption or distances that your vehicles travelled while providing goods or services to your larger customers, so that they can report on their scope 3 emissions.
Here are two simple examples of this:
Fuel-based data request
A cleaning contractor services a number of stores for a national supermarket chain. The supermarket chain reports on its scope 3 emissions, and requests that the contractor provide them with data on the amount of fuel consumed by their vehicles when servicing their stores, broken down by fuel type.
Distance-based data request
A logistics fleet delivers white goods to the customers of a national retail store. The retail store requests that the logistics company provide them with data on the total miles travelled as they completed the delivery of their goods, broken down by vehicle class.
How Geotab can help you provide data for scope 3 reporting
In both of the above instances, the fleet managers would need to use a fleet telematics platform that can track fuel consumption and vehicle mileage at a per vehicle level to calculate their fleet’s scope 1 emissions. If either fleet ran any electric vehicles (EVs), then the telematics platform would also need to track EV miles driven and energy consumption in order to calculate the scope 2 emissions. This data can then be provided to their customers so that they can report on their scope 3 emissions.
MyGeotab’s at-a-glance dashboard reports for fuel consumption and miles driven enable you to quickly access this data for a chosen time period. The fuel and EV energy usage report summarises monthly fuel usage, distance travelled and fuel or electric energy economy. You can view averages for the entire fleet, or filter by specific vehicles, and create zones to attribute activity to specific clients, making it simple to submit the relevant data to your customers.
Fuel and EV Energy Usage report
.png)
And with fill-ups reports that can be integrated with fuel cards, you can be confident that no fuel usage will go unmonitored.
Scope 3 reporting spreads the duty of measuring fleet emissions throughout the supply chain
Even if your organisation doesn’t currently need to report on its own GHG emissions, you may soon find you're being asked to provide this data to organisations higher up your supply chain. This makes it increasingly important for fleets to be able to measure their fuel consumption, distances travelled, and emissions produced.
To make this process easier, you need a telematics partner that can capture the necessary data for your fleet, including all conventional and electric vehicles. Geotab collects all the information your customers will require for their scope 3 GHG emissions reporting, while also providing actionable insights to help you reduce your fuel consumption and associated emissions, with the added value of improving your bottom line.
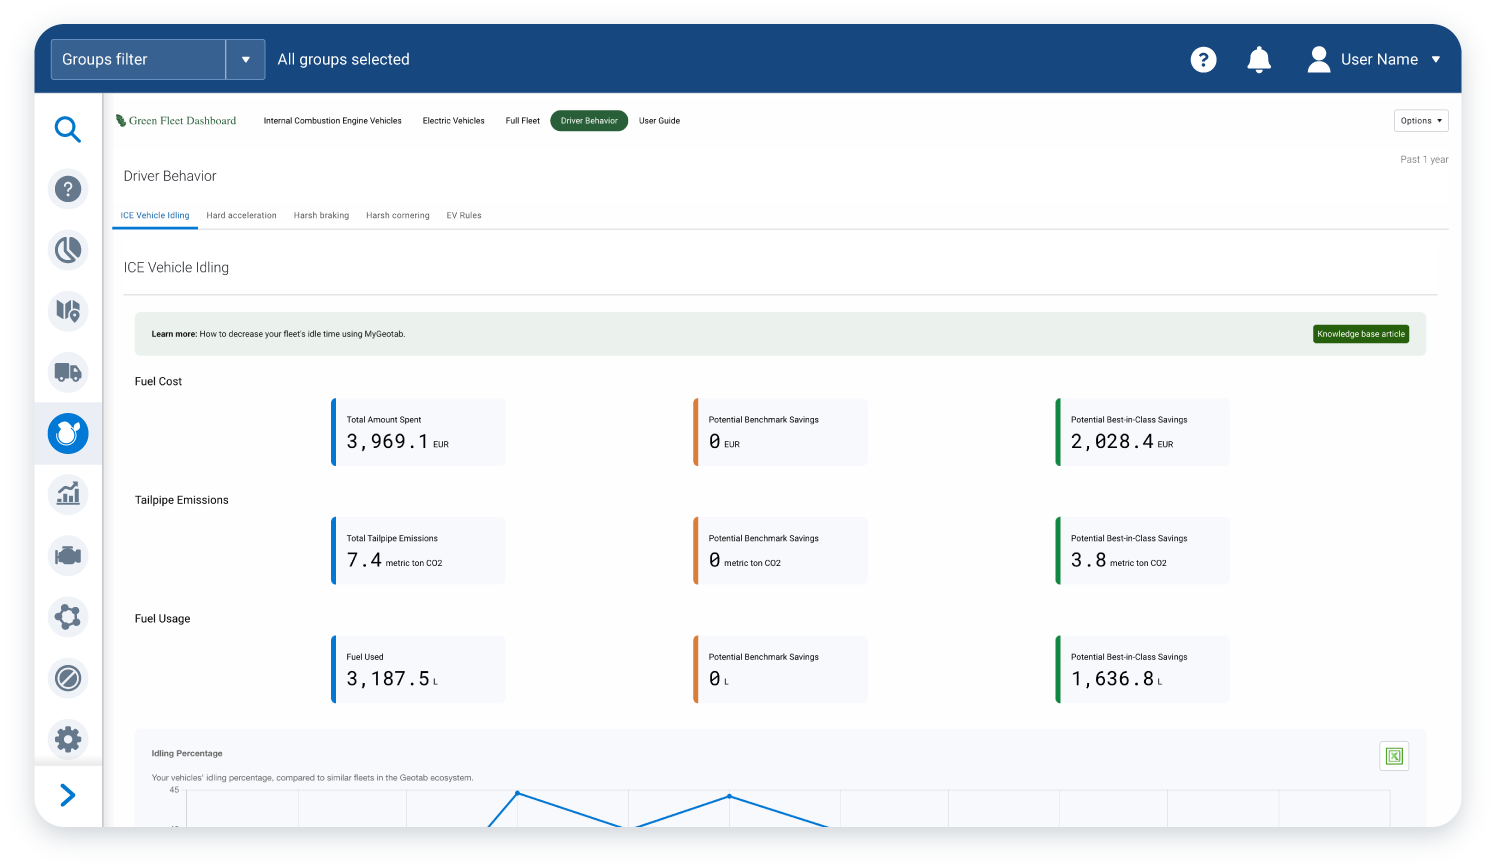
Green Fleet Dashboard - Idling Benchmark report

View our sustainable fleet solutions to learn more.
Subscribe to the Geotab Blog

Associate Vice President, Sales and Business Development, UK & Ireland
Table of contents
Subscribe to the Geotab Blog
Related posts
.jpeg)

Strategic Implementation of Telematics for Optimising Last-Mile Delivery Operations
April 1, 2025
2 minute read
.jpg)
Lead with Trust: How Geotab Helps Businesses Navigate CSRD Compliance
March 19, 2025
2 minute read

Data-Driven Innovations in Fleet Management: highlights from Geotab Mobility Connect 2024
November 28, 2024
3 minute read

2030 or 2035, the UK Needs Meaningful Action on EVs Now
September 6, 2024
2 minute read

Driving smarter: Insights from Geotab’s “Taking Charge” Report
August 8, 2024
2 minute read
